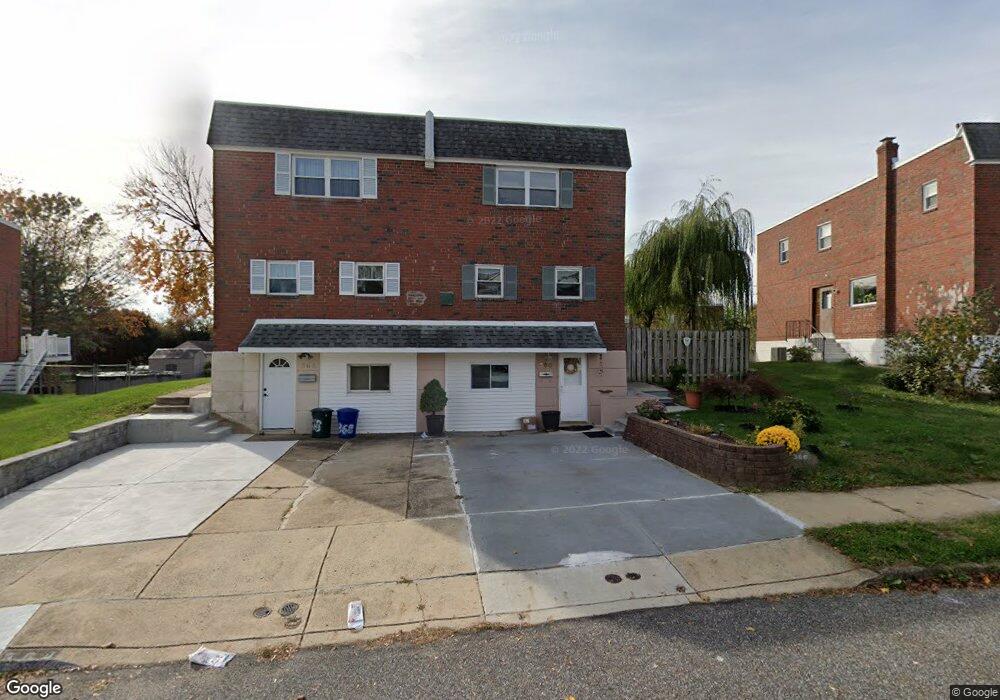
366 Gardner St Philadelphia, PA 19116
Somerton NeighborhoodEstimated Value: $387,294 - $426,000
4
Beds
1
Bath
1,548
Sq Ft
$262/Sq Ft
Est. Value
About This Home
This home is located at 366 Gardner St, Philadelphia, PA 19116 and is currently estimated at $406,324, approximately $262 per square foot. 366 Gardner St is a home with nearby schools including Loesche William H School, CCA Baldi Middle School, and George Washington High School.
Ownership History
Date
Name
Owned For
Owner Type
Purchase Details
Closed on
Oct 23, 2020
Sold by
Ndrio Margarita and Ndrio Vasillaq
Bought by
Ndrio Margarita and Ndrio Vasujlaq
Current Estimated Value
Home Financials for this Owner
Home Financials are based on the most recent Mortgage that was taken out on this home.
Original Mortgage
$159,600
Outstanding Balance
$141,372
Interest Rate
2.8%
Mortgage Type
New Conventional
Estimated Equity
$264,952
Purchase Details
Closed on
Jul 14, 2006
Sold by
Gadebusch James G
Bought by
Ndrio Vasillaq and Ndrio Margarita
Home Financials for this Owner
Home Financials are based on the most recent Mortgage that was taken out on this home.
Original Mortgage
$207,000
Interest Rate
6.67%
Mortgage Type
Purchase Money Mortgage
Purchase Details
Closed on
Dec 18, 1997
Sold by
Nyschit Daniel B and Nyschit Ludmyla L
Bought by
Gadebusch James G
Create a Home Valuation Report for This Property
The Home Valuation Report is an in-depth analysis detailing your home's value as well as a comparison with similar homes in the area
Home Values in the Area
Average Home Value in this Area
Purchase History
| Date | Buyer | Sale Price | Title Company |
|---|---|---|---|
| Ndrio Margarita | -- | None Available | |
| Ndrio Vasillaq | $259,000 | None Available | |
| Gadebusch James G | $107,500 | Lawyers Title Insurance Co |
Source: Public Records
Mortgage History
| Date | Status | Borrower | Loan Amount |
|---|---|---|---|
| Open | Ndrio Margarita | $159,600 | |
| Closed | Ndrio Vasillaq | $207,000 |
Source: Public Records
Tax History Compared to Growth
Tax History
| Year | Tax Paid | Tax Assessment Tax Assessment Total Assessment is a certain percentage of the fair market value that is determined by local assessors to be the total taxable value of land and additions on the property. | Land | Improvement |
|---|---|---|---|---|
| 2026 | $4,044 | $362,000 | $72,400 | $289,600 |
| 2025 | $4,044 | $362,000 | $72,400 | $289,600 |
| 2024 | $4,044 | $362,000 | $72,400 | $289,600 |
| 2023 | $4,044 | $288,900 | $57,780 | $231,120 |
| 2022 | $2,710 | $243,900 | $57,780 | $186,120 |
| 2021 | $3,340 | $0 | $0 | $0 |
| 2020 | $3,340 | $0 | $0 | $0 |
| 2019 | $3,145 | $0 | $0 | $0 |
| 2018 | $2,479 | $0 | $0 | $0 |
| 2017 | $2,899 | $0 | $0 | $0 |
| 2016 | $2,479 | $0 | $0 | $0 |
| 2015 | $2,373 | $0 | $0 | $0 |
| 2014 | -- | $207,100 | $78,359 | $128,741 |
| 2012 | -- | $28,128 | $3,880 | $24,248 |
Source: Public Records
Map
Nearby Homes
- 11012 Audubon Ave
- 375 Avon St
- 11022 Ferndale St
- 370 Selma St
- 441 Tomlinson Rd Unit F6
- 412 Avon Place
- 11243 Jeanes Place
- 10665 Halstead St
- 133 Gardner St
- 118 Rennard Place
- 509 Larkspur St
- 166 Rennard St
- 10922 Lockart Rd
- 11715 Jeanes St
- 10752 Jeanes St
- 11722 Audubon Ave
- 11990 Rennard St
- 10236 Jeanes St
- 11169 Hendrix St
- 226 Lockart Terrace
- 368 Gardner St
- 370 Gardner St
- 364 Gardner St
- 362 Gardner St
- 379 Helene Place
- 372 Gardner St
- 377 Helene Place
- 381 Helene Place
- 374 Gardner St
- 359 Gardner St
- 376 Gardner St
- 357 Gardner St
- 361 Gardner St
- 363 Gardner St
- 383 Helene Place
- 358 Gardner St
- 375 Helene Place
- 355 Gardner St
- 11016 Audubon Ave
- 11014 Audubon Ave