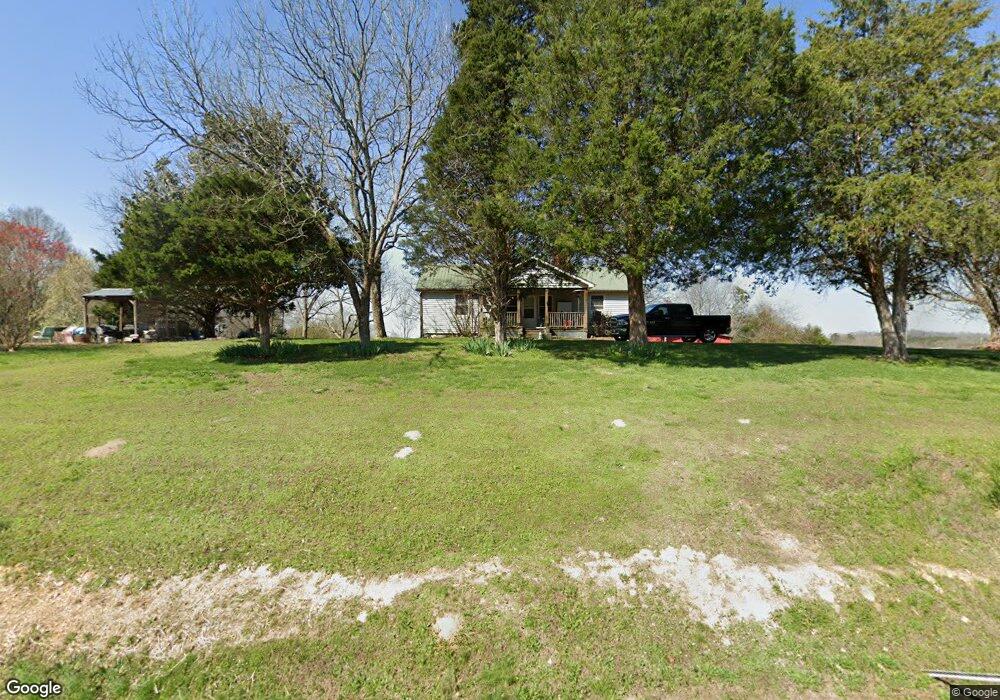
366 Huffman Rd La Fayette, GA 30728
Estimated Value: $195,973 - $356,000
--
Bed
2
Baths
1,372
Sq Ft
$186/Sq Ft
Est. Value
About This Home
This home is located at 366 Huffman Rd, La Fayette, GA 30728 and is currently estimated at $254,743, approximately $185 per square foot. 366 Huffman Rd is a home located in Walker County with nearby schools including Rock Spring Elementary School and Lafayette High School.
Ownership History
Date
Name
Owned For
Owner Type
Purchase Details
Closed on
Mar 3, 2011
Sold by
Stapp Oscar E
Bought by
Garrett Ernest Eugene
Current Estimated Value
Home Financials for this Owner
Home Financials are based on the most recent Mortgage that was taken out on this home.
Original Mortgage
$138,268
Outstanding Balance
$94,869
Interest Rate
4.76%
Mortgage Type
New Conventional
Estimated Equity
$159,874
Purchase Details
Closed on
Mar 29, 1995
Sold by
Davis James A
Bought by
Stapp Oscar E and Stapp Dorothy J
Purchase Details
Closed on
Aug 1, 1990
Sold by
Davis James A
Bought by
Stapp Oscar E and Stapp Dorothy
Purchase Details
Closed on
Dec 7, 1988
Sold by
Gladden Brenda
Bought by
Davis James A
Purchase Details
Closed on
Nov 29, 1988
Sold by
Davis James A
Bought by
Gladden Brenda
Purchase Details
Closed on
Jan 1, 1972
Bought by
Davis James A
Create a Home Valuation Report for This Property
The Home Valuation Report is an in-depth analysis detailing your home's value as well as a comparison with similar homes in the area
Home Values in the Area
Average Home Value in this Area
Purchase History
| Date | Buyer | Sale Price | Title Company |
|---|---|---|---|
| Garrett Ernest Eugene | $134,600 | -- | |
| Stapp Oscar E | -- | -- | |
| Davis James A | -- | -- | |
| Stapp Oscar E | $90,000 | -- | |
| Davis James A | -- | -- | |
| Gladden Brenda | -- | -- | |
| Davis James A | -- | -- |
Source: Public Records
Mortgage History
| Date | Status | Borrower | Loan Amount |
|---|---|---|---|
| Open | Garrett Ernest Eugene | $138,268 |
Source: Public Records
Tax History Compared to Growth
Tax History
| Year | Tax Paid | Tax Assessment Tax Assessment Total Assessment is a certain percentage of the fair market value that is determined by local assessors to be the total taxable value of land and additions on the property. | Land | Improvement |
|---|---|---|---|---|
| 2024 | $713 | $86,052 | $22,960 | $63,092 |
| 2023 | $329 | $71,241 | $11,449 | $59,792 |
| 2022 | $238 | $60,864 | $10,100 | $50,764 |
| 2021 | $237 | $47,444 | $10,100 | $37,344 |
| 2020 | $237 | $42,669 | $10,100 | $32,569 |
| 2019 | $238 | $42,669 | $10,100 | $32,569 |
| 2018 | $1,129 | $42,669 | $10,100 | $32,569 |
| 2017 | $294 | $42,669 | $10,100 | $32,569 |
| 2016 | $141 | $24,866 | $10,100 | $14,766 |
| 2015 | $142 | $32,529 | $9,080 | $23,449 |
| 2014 | $76 | $32,529 | $9,080 | $23,449 |
| 2013 | -- | $32,528 | $9,080 | $23,448 |
Source: Public Records
Map
Nearby Homes
- 1052 Huffman Rd
- 201 Van Dell Dr
- 3255 Colbert Hollow Rd
- 533 Van Dell Dr
- 0 Alabama Hwy Unit 1520958
- 0 Alabama Hwy Unit 21222630
- 0 Alabama Hwy Unit TRACT 3 10244950
- 134 Farm View Cir
- 200 Cattail Dr
- Old Alabama Hwy Ga-151
- 7606 Highway 95
- 72 Brutis Dr
- 0 Temperance Hall Rd Unit 10506446
- 0 Temperance Hall Rd Unit 1510568
- 1282 Temperance Hall Rd
- 6280 Georgia 151
- 0 Colbert Hollow Rd Unit 1513202
- 265 Rodeo Dr
- 287 E Teems Rd
- 76 Side Kick Ln
- 430 Hollyhock Ln
- 375 Hollyhock Ln
- 254 Chapman Ct
- 189 Huffman Rd
- 252 Chapman Ct
- 636 Huffman Rd
- 129 Chapman Ct
- 35 Chapman Ct
- 0 Chapman Ct Unit 8400560
- 0 Chapman Ct
- 194 Chapman Ct
- 210 Chapman Ct
- 210 Chapman Ct
- 108 Hollyhock Ln
- 791 Huffman Rd
- 791 Huffman Rd
- 110 Chapman Ct
- 351 Chapman Rd
- 889 Huffman Rd
- 1952 Huffman Rd