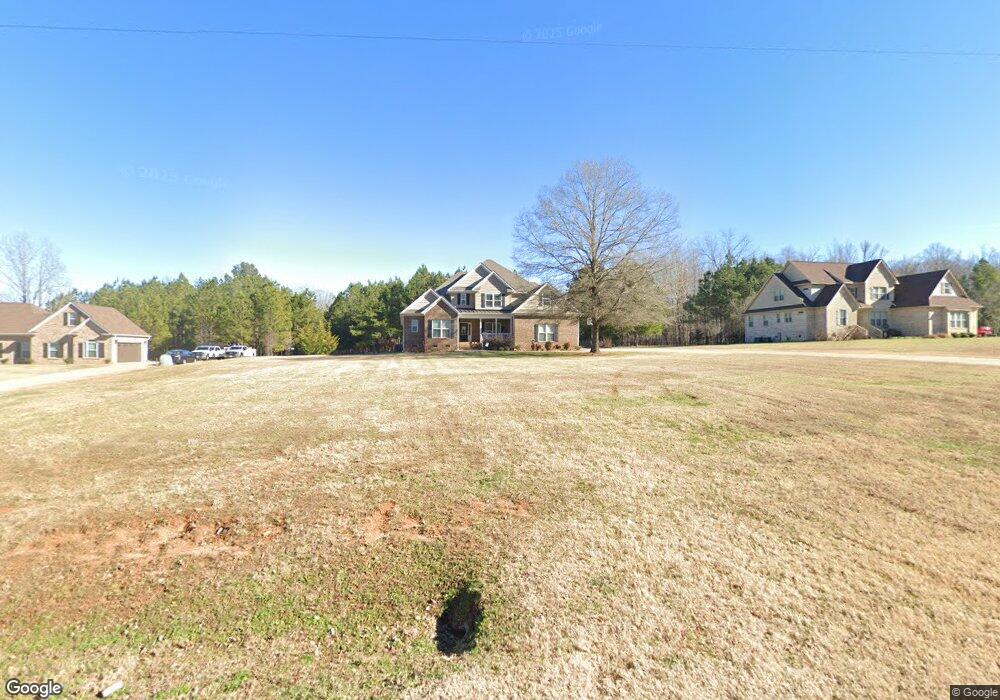
366 Kingsburry Rd Unit 3 Clover, SC 29710
Estimated Value: $793,000 - $855,000
4
Beds
3
Baths
3,690
Sq Ft
$224/Sq Ft
Est. Value
About This Home
This home is located at 366 Kingsburry Rd Unit 3, Clover, SC 29710 and is currently estimated at $826,588, approximately $224 per square foot. 366 Kingsburry Rd Unit 3 is a home located in York County with nearby schools including Bethel Elementary School, Oakridge Middle School, and Clover High School.
Ownership History
Date
Name
Owned For
Owner Type
Purchase Details
Closed on
Aug 19, 2022
Sold by
Gibson Iii Charles S
Bought by
Camp Richard A and Camp Jennifer T
Current Estimated Value
Home Financials for this Owner
Home Financials are based on the most recent Mortgage that was taken out on this home.
Original Mortgage
$490,000
Outstanding Balance
$462,248
Interest Rate
4%
Mortgage Type
New Conventional
Estimated Equity
$364,340
Purchase Details
Closed on
Apr 20, 2020
Sold by
Homes By Christopher Llc
Bought by
Gibson Charles S
Home Financials for this Owner
Home Financials are based on the most recent Mortgage that was taken out on this home.
Original Mortgage
$468,000
Interest Rate
3.2%
Mortgage Type
New Conventional
Purchase Details
Closed on
Apr 15, 2020
Sold by
Brookshire Woods Llc
Bought by
Homes By Christopher Llc
Home Financials for this Owner
Home Financials are based on the most recent Mortgage that was taken out on this home.
Original Mortgage
$468,000
Interest Rate
3.2%
Mortgage Type
New Conventional
Create a Home Valuation Report for This Property
The Home Valuation Report is an in-depth analysis detailing your home's value as well as a comparison with similar homes in the area
Home Values in the Area
Average Home Value in this Area
Purchase History
| Date | Buyer | Sale Price | Title Company |
|---|---|---|---|
| Camp Richard A | $750,000 | J Ryan Chandler Iii Chandler & | |
| Gibson Charles S | $520,000 | None Available | |
| Homes By Christopher Llc | -- | None Available |
Source: Public Records
Mortgage History
| Date | Status | Borrower | Loan Amount |
|---|---|---|---|
| Open | Camp Richard A | $490,000 | |
| Previous Owner | Gibson Charles S | $468,000 |
Source: Public Records
Tax History Compared to Growth
Tax History
| Year | Tax Paid | Tax Assessment Tax Assessment Total Assessment is a certain percentage of the fair market value that is determined by local assessors to be the total taxable value of land and additions on the property. | Land | Improvement |
|---|---|---|---|---|
| 2024 | $3,984 | $28,197 | $3,400 | $24,797 |
| 2023 | $16,470 | $42,295 | $5,100 | $37,195 |
| 2022 | $2,455 | $20,562 | $1,520 | $19,042 |
| 2021 | -- | $30,843 | $2,280 | $28,563 |
| 2020 | $769 | $2,280 | $0 | $0 |
| 2019 | $4 | $32,850 | $0 | $0 |
| 2018 | $4 | $10 | $0 | $0 |
| 2017 | -- | $10 | $0 | $0 |
Source: Public Records
Map
Nearby Homes
- 514 Bethel School Rd
- 109 Highland Forest Dr
- 3040 Patrick Place Cir
- 233 Highland Forest Dr
- 179 N Paraham Rd
- 221 Burree Rd
- 2599 Highway 557 None
- 558 Red Wolf Ln
- 10.64 AC Burree Rd
- 10.64 AC Burree Rd Unit 6
- 360 Reedy River Ln
- 1338 Fishing Creek Rd
- 241 Boxelder Rd
- 1321 Fishing Creek Rd
- 222 Boxelder Rd
- 234 Boxelder Rd
- 1305 Fishing Creek Rd
- 9 AC Burree Rd
- 5966 Quarter Mile Rd
- Lot 36 Snow Goose Walk Ct
- 366 Kingsburry Rd
- 354 Kingsburry Rd
- 378 Kingsburry Rd Unit 4
- 380 N Kingsburry Rd
- 342 Kingsburry Rd
- 342 Kingsburry Rd Unit 1
- 388 Kingsburry Rd
- 398 Kingsburry Rd Unit 6
- 398 Kingsburry Rd Unit Lot 6
- 408 Kingsburry Rd
- 560 N Kingsburry Rd
- 6186 Chandler Rd
- 418 Kingsburry Rd
- 418 Kingsburry Rd Unit 8
- 418 Kingsburry Rd Unit Lot 8
- 6200 Chandler Rd
- 430 Kingsburry Rd Unit 9
- 440 Kingsburry Rd
- 440 Kingsburry Rd Unit 10
- 6180 Chandler Rd