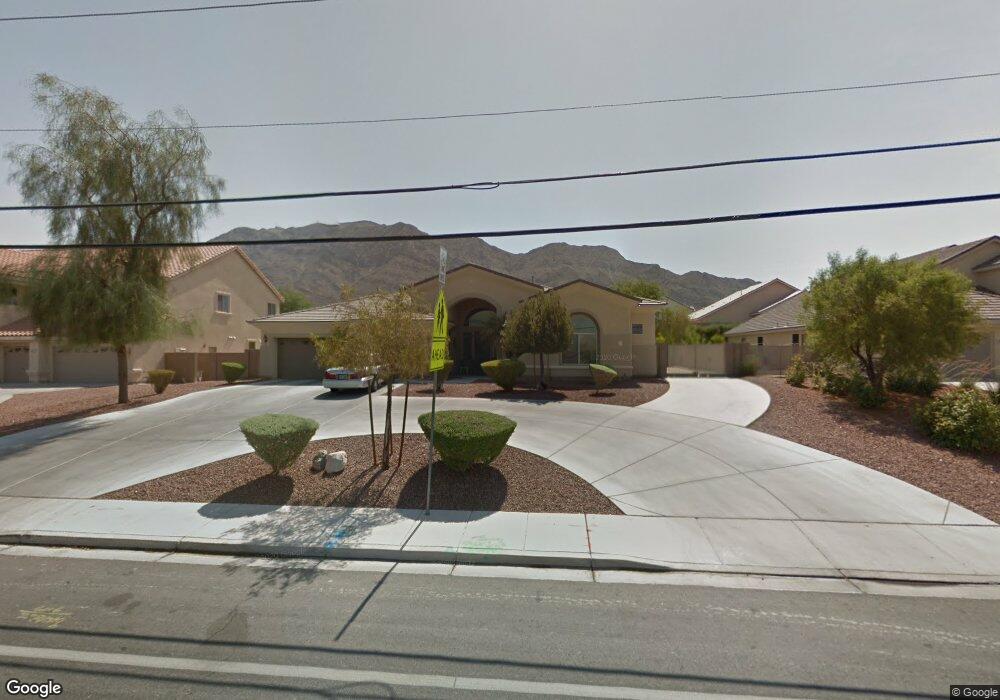
366 N Hollywood Blvd Las Vegas, NV 89110
Estimated Value: $672,257 - $735,000
4
Beds
3
Baths
3,266
Sq Ft
$218/Sq Ft
Est. Value
About This Home
This home is located at 366 N Hollywood Blvd, Las Vegas, NV 89110 and is currently estimated at $712,814, approximately $218 per square foot. 366 N Hollywood Blvd is a home located in Clark County with nearby schools including Mervin Iverson Elementary School, Kathleen & Tim Harney Middle School, and Las Vegas High School.
Ownership History
Date
Name
Owned For
Owner Type
Purchase Details
Closed on
Aug 11, 2025
Sold by
Cotts Frederick D G and Cotts Deborah
Bought by
Cotts Revocable Trust and Cotts
Current Estimated Value
Purchase Details
Closed on
May 28, 2021
Sold by
Margolis Mark A and Margolis Sheryl E
Bought by
Cotts Frederick D G and Cotts Deborah
Home Financials for this Owner
Home Financials are based on the most recent Mortgage that was taken out on this home.
Original Mortgage
$531,643
Interest Rate
3%
Mortgage Type
New Conventional
Purchase Details
Closed on
Nov 14, 2003
Sold by
Us Home Corp
Bought by
Margolis Mark A and Margolis Sheryl E
Home Financials for this Owner
Home Financials are based on the most recent Mortgage that was taken out on this home.
Original Mortgage
$321,600
Interest Rate
4.12%
Mortgage Type
Unknown
Create a Home Valuation Report for This Property
The Home Valuation Report is an in-depth analysis detailing your home's value as well as a comparison with similar homes in the area
Home Values in the Area
Average Home Value in this Area
Purchase History
| Date | Buyer | Sale Price | Title Company |
|---|---|---|---|
| Cotts Revocable Trust | -- | None Listed On Document | |
| Cotts Frederick D G | $550,000 | First American Title Insu | |
| Margolis Mark A | $338,542 | North American Title Co |
Source: Public Records
Mortgage History
| Date | Status | Borrower | Loan Amount |
|---|---|---|---|
| Previous Owner | Cotts Frederick D G | $531,643 | |
| Previous Owner | Margolis Mark A | $321,600 |
Source: Public Records
Tax History Compared to Growth
Tax History
| Year | Tax Paid | Tax Assessment Tax Assessment Total Assessment is a certain percentage of the fair market value that is determined by local assessors to be the total taxable value of land and additions on the property. | Land | Improvement |
|---|---|---|---|---|
| 2025 | $3,415 | $187,378 | $48,825 | $138,553 |
| 2024 | $3,316 | $187,378 | $48,825 | $138,553 |
| 2023 | $2,675 | $176,513 | $45,675 | $130,838 |
| 2022 | $3,220 | $160,526 | $40,950 | $119,576 |
| 2021 | $3,268 | $146,843 | $33,075 | $113,768 |
| 2020 | $3,032 | $142,344 | $29,925 | $112,419 |
| 2019 | $2,995 | $136,992 | $26,775 | $110,217 |
| 2018 | $2,858 | $126,521 | $26,775 | $99,746 |
| 2017 | $3,892 | $132,624 | $25,200 | $107,424 |
| 2016 | $2,675 | $100,520 | $17,325 | $83,195 |
| 2015 | $2,670 | $88,237 | $15,750 | $72,487 |
| 2014 | $2,592 | $87,418 | $12,600 | $74,818 |
Source: Public Records
Map
Nearby Homes
- 6677 Turtle Hill Rd
- 6688 Martinsville Place
- 6632 Isolated Ave
- 6520 Turtle Hill Rd
- 100 Spanish Dr
- 255 Vista Valley St
- 0 Vista Valley St
- 6664 Secluded Ave
- 485 Sari Dr
- 6596 Secluded Ave
- 0 Peaceful St
- 0 Linden Ave
- 706 N Hollywood Blvd
- 0 Sunrise & Phyllis Unit 2712586
- 6440 Spanish Garden Ct
- 738 Rossmore Dr
- 6400 Stewart Ave
- 0 Lailani St
- 650 N Hollywood Blvd
- 807 Sun Shimmer Place
- 350 N Hollywood Blvd Unit 1
- 382 N Hollywood Blvd
- 375 Royal Legacy Ln Unit 1
- 349 Royal Legacy Ln
- 334 N Hollywood Blvd
- 6760 Ancestral Hills Ln
- 333 Royal Legacy Ln
- 318 N Hollywood Blvd
- 416 N Hollywood Blvd
- 6765 Ancestral Hills Ln
- 317 Royal Legacy Ln
- 341 N Hollywood Blvd
- 6774 Ancestral Hills Ln
- 421 Wilshire Blvd
- 6760 Vintage Hills Ct
- 432 N Hollywood Blvd
- 6689 Weather View Dr
- 6690 Turtle Hill Rd
- 301 Royal Legacy Ln
- 6788 Ancestral Hills Ln