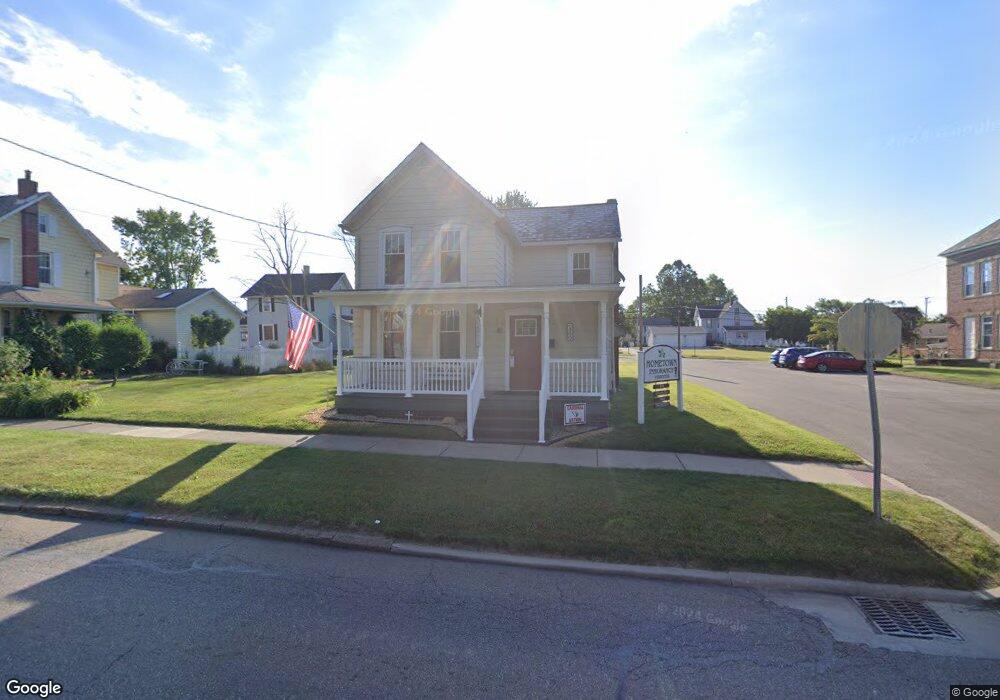
366 N Main St Magnolia, OH 44643
Estimated Value: $139,838 - $171,000
3
Beds
1
Bath
1,616
Sq Ft
$95/Sq Ft
Est. Value
About This Home
This home is located at 366 N Main St, Magnolia, OH 44643 and is currently estimated at $153,613, approximately $95 per square foot. 366 N Main St is a home located in Stark County with nearby schools including Sandy Valley Elementary School, Sandy Valley Middle School, and Sandy Valley High School.
Ownership History
Date
Name
Owned For
Owner Type
Purchase Details
Closed on
Sep 18, 2019
Sold by
Finnicum James C and Finnicum Susan K
Bought by
Finnicum Hometown Agency Llc
Current Estimated Value
Home Financials for this Owner
Home Financials are based on the most recent Mortgage that was taken out on this home.
Original Mortgage
$86,000
Outstanding Balance
$75,329
Interest Rate
3.6%
Mortgage Type
Seller Take Back
Estimated Equity
$78,284
Purchase Details
Closed on
Jun 10, 2011
Sold by
Finnicum James C and Finnicum Susan K
Bought by
Finnicum James C and Finnicum Susan K
Purchase Details
Closed on
May 8, 2000
Sold by
Farber Harold J and Farber Mottice J
Bought by
Finnicum James C and Finnicum Susan K
Create a Home Valuation Report for This Property
The Home Valuation Report is an in-depth analysis detailing your home's value as well as a comparison with similar homes in the area
Home Values in the Area
Average Home Value in this Area
Purchase History
| Date | Buyer | Sale Price | Title Company |
|---|---|---|---|
| Finnicum Hometown Agency Llc | $100,000 | None Available | |
| Finnicum James C | -- | Attorney | |
| Finnicum James C | $61,500 | -- |
Source: Public Records
Mortgage History
| Date | Status | Borrower | Loan Amount |
|---|---|---|---|
| Open | Finnicum Hometown Agency Llc | $86,000 |
Source: Public Records
Tax History Compared to Growth
Tax History
| Year | Tax Paid | Tax Assessment Tax Assessment Total Assessment is a certain percentage of the fair market value that is determined by local assessors to be the total taxable value of land and additions on the property. | Land | Improvement |
|---|---|---|---|---|
| 2025 | -- | $23,660 | $5,320 | $18,340 |
| 2024 | -- | $23,660 | $5,320 | $18,340 |
| 2023 | $2,266 | $21,490 | $4,830 | $16,660 |
| 2022 | $1,472 | $21,490 | $4,830 | $16,660 |
| 2021 | $1,477 | $21,490 | $4,830 | $16,660 |
| 2020 | $1,445 | $20,450 | $4,590 | $15,860 |
| 2019 | $1,507 | $20,450 | $4,590 | $15,860 |
| 2018 | $1,446 | $20,450 | $4,590 | $15,860 |
| 2017 | $1,268 | $15,940 | $3,820 | $12,120 |
| 2016 | $1,271 | $15,940 | $3,820 | $12,120 |
| 2015 | $1,284 | $20,980 | $6,480 | $14,500 |
| 2014 | $1,040 | $16,460 | $5,110 | $11,350 |
| 2013 | $524 | $16,460 | $5,110 | $11,350 |
Source: Public Records
Map
Nearby Homes
- 217 E Carrollton St
- 614 Levee Cir
- 715 Minerva Rd
- 1.06 Ac Vacant Lot N Lynnwood Dr
- 1.25 Ac Vacant Lot N Lynnwood Dr
- 5500 Westbrook St SE
- 3750 Farber St SE
- 3799 Westbrook St SE
- 5488 Elson St SE
- 0 W Lisbon St
- 156 W Lisbon St
- 0 Goodland St SE
- 0 Lampe Lane North E Unit 5162024
- 5236 Hilltop Dr NE
- 10440 Circle Dr SE
- 7796 Mottice Dr SE
- 5416 M Ave
- 0 Elson St SE Unit 5130913
- 2251 Farber St
- 5219 N St NE