366 N Shady Ln Elmhurst, IL 60126
Estimated Value: $630,343 - $815,000
Studio
--
Bath
2,516
Sq Ft
$280/Sq Ft
Est. Value
About This Home
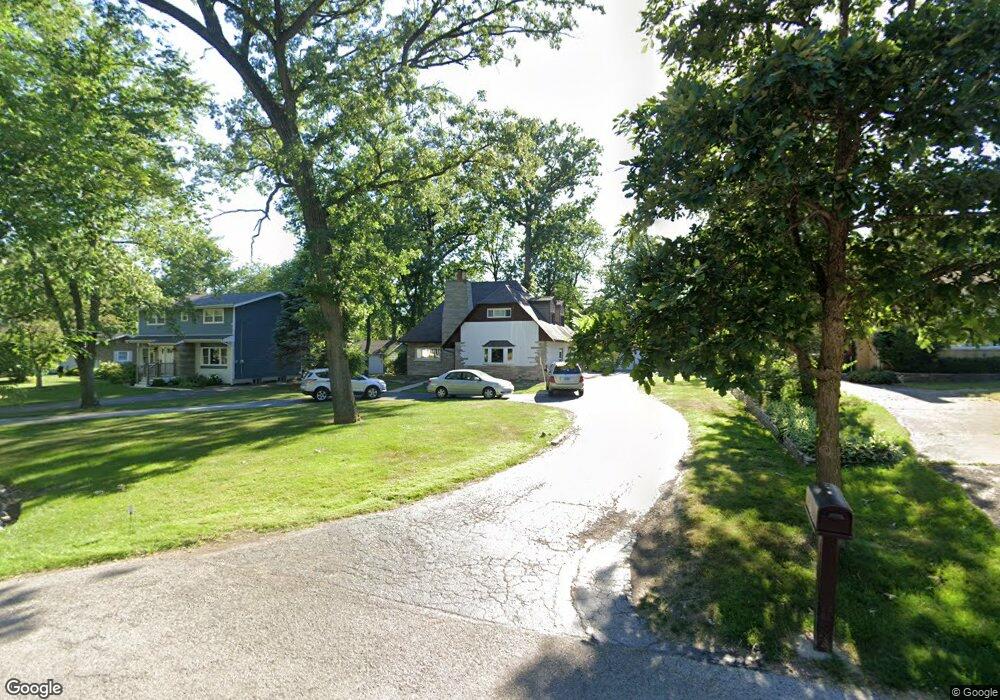
This home is located at 366 N Shady Ln, Elmhurst, IL 60126 and is currently estimated at $704,586, approximately $280 per square foot. 366 N Shady Ln is a home located in DuPage County with nearby schools including Emerson Elementary School, Churchville Middle School, and York Community High School.
Ownership History
Date
Name
Owned For
Owner Type
Purchase Details
Closed on
Feb 19, 2003
Sold by
Emmerich Mark and Lovecchio Deanna
Bought by
Emmerich Mark and Emmerich Deanna
Current Estimated Value
Purchase Details
Closed on
May 21, 2001
Sold by
Stott James D and Stott Diane Pearson
Bought by
Emmerich Mark and Lovecchio Deanna
Home Financials for this Owner
Home Financials are based on the most recent Mortgage that was taken out on this home.
Original Mortgage
$342,000
Outstanding Balance
$128,080
Interest Rate
7.07%
Estimated Equity
$576,506
Purchase Details
Closed on
Sep 15, 1994
Sold by
Meyer Diane and Delahanty Patrick
Bought by
Stott Diane Pearson and Stott James D
Home Financials for this Owner
Home Financials are based on the most recent Mortgage that was taken out on this home.
Original Mortgage
$192,000
Interest Rate
6.12%
Create a Home Valuation Report for This Property
The Home Valuation Report is an in-depth analysis detailing your home's value as well as a comparison with similar homes in the area
Home Values in the Area
Average Home Value in this Area
Purchase History
| Date | Buyer | Sale Price | Title Company |
|---|---|---|---|
| Emmerich Mark | -- | -- | |
| Emmerich Mark | $380,000 | -- | |
| Stott Diane Pearson | $240,000 | -- |
Source: Public Records
Mortgage History
| Date | Status | Borrower | Loan Amount |
|---|---|---|---|
| Open | Emmerich Mark | $342,000 | |
| Previous Owner | Stott Diane Pearson | $192,000 |
Source: Public Records
Tax History
| Year | Tax Paid | Tax Assessment Tax Assessment Total Assessment is a certain percentage of the fair market value that is determined by local assessors to be the total taxable value of land and additions on the property. | Land | Improvement |
|---|---|---|---|---|
| 2024 | $11,774 | $200,264 | $67,639 | $132,625 |
| 2023 | $10,868 | $184,100 | $62,180 | $121,920 |
| 2022 | $12,146 | $204,280 | $60,070 | $144,210 |
| 2021 | $11,633 | $195,670 | $57,540 | $138,130 |
| 2020 | $10,952 | $187,420 | $55,110 | $132,310 |
| 2019 | $10,846 | $180,210 | $52,990 | $127,220 |
| 2018 | $9,688 | $160,680 | $53,000 | $107,680 |
| 2017 | $9,503 | $153,560 | $50,650 | $102,910 |
| 2016 | $9,113 | $141,770 | $46,760 | $95,010 |
| 2015 | $8,944 | $130,970 | $43,200 | $87,770 |
| 2014 | $9,209 | $124,280 | $44,540 | $79,740 |
| 2013 | $9,168 | $126,820 | $45,450 | $81,370 |
Source: Public Records
Map
Nearby Homes
- 594 W Comstock Ave
- 432 N Ridgeland Ave
- 528 West Ave
- 526 N West Ave
- 656 W Comstock Ave
- 639 W Comstock Ave
- 655 W Comstock Ave
- 468 N Highland Ave
- 322 N Highland Ave
- 284 N Highland Ave
- 367 N Oak St
- 365 N Walnut St
- 600 E Armitage Ave
- 1044 S Ellsworth Ave
- 204 E Hill St
- 871 S Chatham Ave
- 17W517 Manor Ln
- 902 E Krage Dr
- 196 N Walnut St
- 266 W Fremont Ave
- 372 N Shady Ln
- 360 N Shady Ln
- 352 N Shady Ln
- 365 N River Glen Ave
- 373 N River Glen Ave
- 365 N Shady Ln
- 347 N River Glen Ave
- 348 N Shady Ln
- 381 N River Glen Ave
- 375 N Shady Ln
- 345 N River Glen Ave
- 381 N Shady Ln
- 351 N Shady Ln
- 342 N Shady Ln
- 343 N River Glen Ave
- 392 N Shady Ln
- 360 N River Glen Ave
- 391 N River Glen Ave
- 341 N River Glen Ave