K
Seller's Agent in 2019
Krisa Cox
NOT A VALID MEMBER
Estimated Value: $571,000 - $620,000
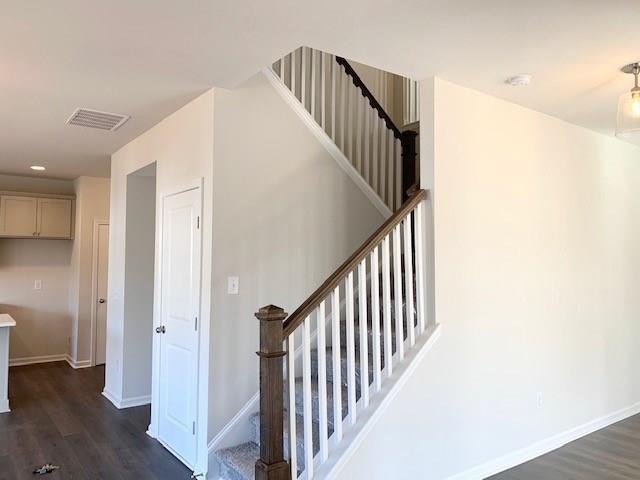
WELLBOURNE PLAN ON NICE LEVEL CULDESAC HOMESITE! READY JULY. OPEN FLOOR PLAN! LARGE OPEN KITCHEN TO THE FAMILY ROOM, LARGE ISLAND,SEPARATE DINING AND LIVING ROOM. JACK AND JILL BATH FOR BEDROOMS 3 AND 4, BEDROOM 4 HAS PRIVATE BATH. THE OWNER'S SUITE CLOSET IS HUGE! NEW FEATURES INCLUDE BUILT IN KITCHEN APPLIANCES, HARDWOOD FLOORING IN KITCHEN, BREAKFAST ROOM AND FOYER, 42 INCH CABINETS.HURRY AND MAKE SELECTIONS. STOCK PHOTOS SHOWN. SELECTIONS MAY VARY IN ACTUAL HOME.LOW ASSOCIATION FEES $966 FOR 3 POOLS, 8 TENNIS COURTS, 2 LAKES, CLUB HOUSE W/ FULL TIME DIRECTOR.
Last Agent to Sell the Property
Krisa Cox
NOT A VALID MEMBER License #170682 Listed on: 04/16/2019

Co-Listed By
Rebecca Miller
NOT A VALID MEMBER License #276823
| Date | Buyer | Sale Price | Title Company |
|---|---|---|---|
| Lunsford Derek J | $328,670 | -- |
| Date | Status | Borrower | Loan Amount |
|---|---|---|---|
| Open | Lunsford Derek J | $322,716 |
| Date | Event | Price | List to Sale | Price per Sq Ft | Prior Sale |
|---|---|---|---|---|---|
| 08/14/2019 08/14/19 | Sold | $328,670 | 0.0% | $113 / Sq Ft | |
| 05/21/2019 05/21/19 | Pending | -- | -- | -- | |
| 04/16/2019 04/16/19 | For Sale | $328,670 | +0.4% | $113 / Sq Ft | |
| 03/01/2019 03/01/19 | Sold | $327,395 | -0.2% | -- | View Prior Sale |
| 02/15/2019 02/15/19 | Pending | -- | -- | -- | |
| 12/06/2018 12/06/18 | Price Changed | $327,895 | -2.5% | -- | |
| 11/13/2018 11/13/18 | Price Changed | $336,395 | -2.4% | -- | |
| 11/12/2018 11/12/18 | Price Changed | $344,525 | -0.1% | -- | |
| 09/02/2018 09/02/18 | Price Changed | $344,940 | +5.7% | -- | |
| 08/30/2018 08/30/18 | For Sale | $326,440 | -- | -- |
| Year | Tax Paid | Tax Assessment Tax Assessment Total Assessment is a certain percentage of the fair market value that is determined by local assessors to be the total taxable value of land and additions on the property. | Land | Improvement |
|---|---|---|---|---|
| 2025 | $11,258 | $257,720 | $42,000 | $215,720 |
| 2024 | $6,031 | $234,480 | $40,000 | $194,480 |
| 2023 | $496 | $227,320 | $40,000 | $187,320 |
| 2022 | $5,437 | $201,280 | $34,000 | $167,280 |
| 2021 | $3,784 | $158,960 | $27,000 | $131,960 |
| 2020 | $4,363 | $131,480 | $22,072 | $109,408 |
| 2019 | $604 | $24,000 | $24,000 | $0 |
K
Seller's Agent in 2019
Krisa Cox
NOT A VALID MEMBER
R
Seller Co-Listing Agent in 2019
Rebecca Miller
NOT A VALID MEMBER
Seller Co-Listing Agent in 2019
Barbara Glore
Berkshire Hathaway HomeServices Georgia Properties
(770) 313-4160
18 Total Sales
Buyer's Agent in 2019
Lynne Irby
Icon Real Estate Group, LLC
(770) 568-9192
45 Total Sales
J
Buyer's Agent in 2019
Jenny Reece
NOT A VALID MEMBER
Source: First Multiple Listing Service (FMLS)
MLS Number: 6537565
APN: 15N19B-00000-581-000
Disclaimer: Certain information contained herein is derived from information provided by parties other than Homes.com. All information provided is deemed reliable, but is not guaranteed to be accurate and should be independently verified.
![]() Listings identified with the FMLS IDX logo come from FMLS and are held by brokerage firms other than the owner of this website. The listing brokerage is identified in any listing details. Information is deemed reliable but is not guaranteed. If you believe any FMLS listing contains material that infringes your copyrighted work please visit www.fmls.com/dmca to review our DMCA policy and learn how to submit a takedown request. © 2025 First Multiple Listing Service, Inc.
Listings identified with the FMLS IDX logo come from FMLS and are held by brokerage firms other than the owner of this website. The listing brokerage is identified in any listing details. Information is deemed reliable but is not guaranteed. If you believe any FMLS listing contains material that infringes your copyrighted work please visit www.fmls.com/dmca to review our DMCA policy and learn how to submit a takedown request. © 2025 First Multiple Listing Service, Inc.