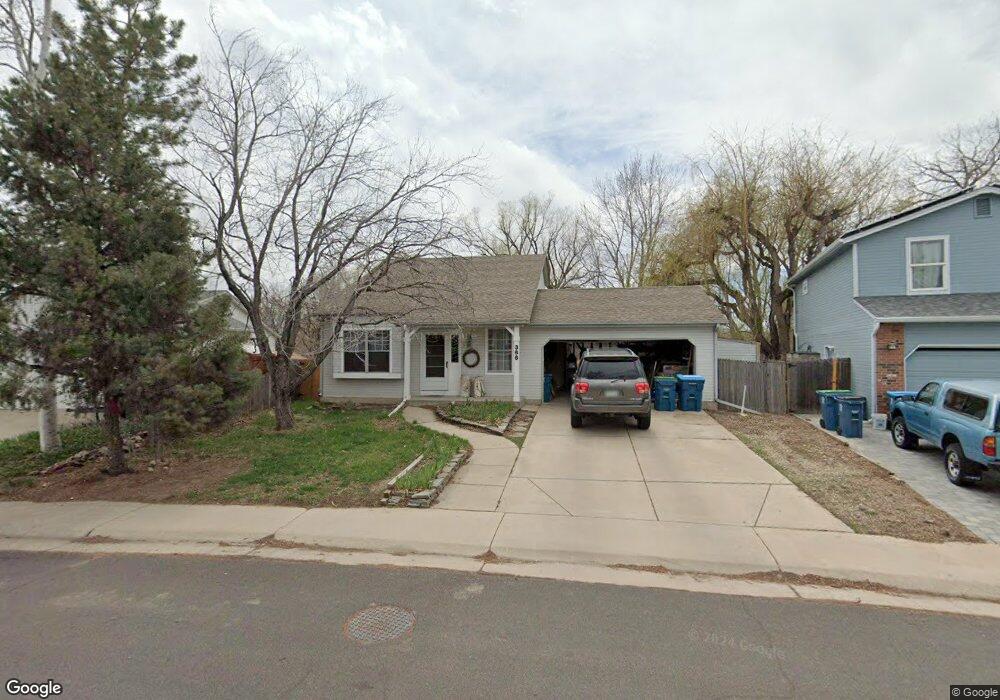
366 S Jefferson Ave Louisville, CO 80027
Estimated Value: $653,000 - $737,000
3
Beds
2
Baths
1,200
Sq Ft
$583/Sq Ft
Est. Value
About This Home
This home is located at 366 S Jefferson Ave, Louisville, CO 80027 and is currently estimated at $699,181, approximately $582 per square foot. 366 S Jefferson Ave is a home located in Boulder County with nearby schools including Louisville Elementary School, Louisville Middle School, and Monarch High School.
Ownership History
Date
Name
Owned For
Owner Type
Purchase Details
Closed on
May 24, 2023
Sold by
Dicesare Steven
Bought by
Dicesare Chris
Current Estimated Value
Purchase Details
Closed on
Nov 24, 2021
Sold by
Hansen Patricia J
Bought by
Dicesare Chris and Dicesare Steven
Home Financials for this Owner
Home Financials are based on the most recent Mortgage that was taken out on this home.
Original Mortgage
$460,000
Interest Rate
3.09%
Mortgage Type
New Conventional
Purchase Details
Closed on
Mar 18, 2003
Sold by
Rayburg Philip T and Rayburg Elizabeth
Bought by
Hansen John T
Home Financials for this Owner
Home Financials are based on the most recent Mortgage that was taken out on this home.
Original Mortgage
$220,000
Interest Rate
5.83%
Purchase Details
Closed on
Feb 25, 1987
Bought by
Hansen John T and Hansen Patricia J
Purchase Details
Closed on
Mar 24, 1983
Bought by
Hansen John T and Hansen Patricia J
Purchase Details
Closed on
Apr 23, 1982
Bought by
Hansen John T and Hansen Patricia J
Create a Home Valuation Report for This Property
The Home Valuation Report is an in-depth analysis detailing your home's value as well as a comparison with similar homes in the area
Home Values in the Area
Average Home Value in this Area
Purchase History
| Date | Buyer | Sale Price | Title Company |
|---|---|---|---|
| Dicesare Chris | -- | None Listed On Document | |
| Dicesare Chris | $575,000 | Heritage Title Co | |
| Hansen John T | $275,000 | Land Title | |
| Hansen John T | $89,000 | -- | |
| Hansen John T | $84,200 | -- | |
| Hansen John T | -- | -- |
Source: Public Records
Mortgage History
| Date | Status | Borrower | Loan Amount |
|---|---|---|---|
| Previous Owner | Dicesare Chris | $460,000 | |
| Previous Owner | Hansen John T | $220,000 |
Source: Public Records
Tax History Compared to Growth
Tax History
| Year | Tax Paid | Tax Assessment Tax Assessment Total Assessment is a certain percentage of the fair market value that is determined by local assessors to be the total taxable value of land and additions on the property. | Land | Improvement |
|---|---|---|---|---|
| 2025 | $3,963 | $45,169 | $19,044 | $26,125 |
| 2024 | $3,963 | $45,169 | $19,044 | $26,125 |
| 2023 | $3,895 | $44,086 | $20,147 | $27,624 |
| 2022 | $3,374 | $35,056 | $15,109 | $19,947 |
| 2021 | $3,516 | $37,959 | $16,359 | $21,600 |
| 2020 | $3,329 | $35,571 | $15,444 | $20,127 |
| 2019 | $3,282 | $35,571 | $15,444 | $20,127 |
| 2018 | $2,724 | $30,485 | $8,856 | $21,629 |
| 2017 | $2,669 | $33,703 | $9,791 | $23,912 |
| 2016 | $2,427 | $27,589 | $10,268 | $17,321 |
| 2015 | $2,301 | $25,209 | $13,850 | $11,359 |
| 2014 | $2,155 | $25,209 | $13,850 | $11,359 |
Source: Public Records
Map
Nearby Homes
- 298 S Hoover Ave
- 111 Barbara St
- 503 Lois Dr
- 203 Springs Dr
- 196 Lincoln Cir
- 539 Coal Creek Ln
- 291 W Sycamore Ln
- 516 Grant Ave
- 567 Manorwood Ln
- 242 Clementina St
- 380 County Rd
- TBD L12 County Rd 255
- TBD L14 County Rd 255
- TBD L2 County Rd 255
- TBD L8 County Rd 255
- 529 Main St
- 549 Parbois Ln
- 385 East St
- 415 East St
- 625 Lombardi Cir
- 372 S Jefferson Ave
- 362 S Jefferson Ave
- 384 S Jefferson Ave
- 360 S Jefferson Ave
- 373 S Jefferson Ave
- 375 S Jefferson Ave
- 361 S Jefferson Ave
- 340 Chestnut St
- 352 S Jefferson Ave
- 334 Chestnut St
- 350 S Jefferson Ave
- 450 Lilac Ct
- 349 Chestnut St
- 438 Lilac Ct
- 345 Chestnut St
- 351 S Jefferson Ave
- 337 Chestnut St
- 332 Chestnut St
- 348 S Jefferson Ave
- 498 Lilac Ct