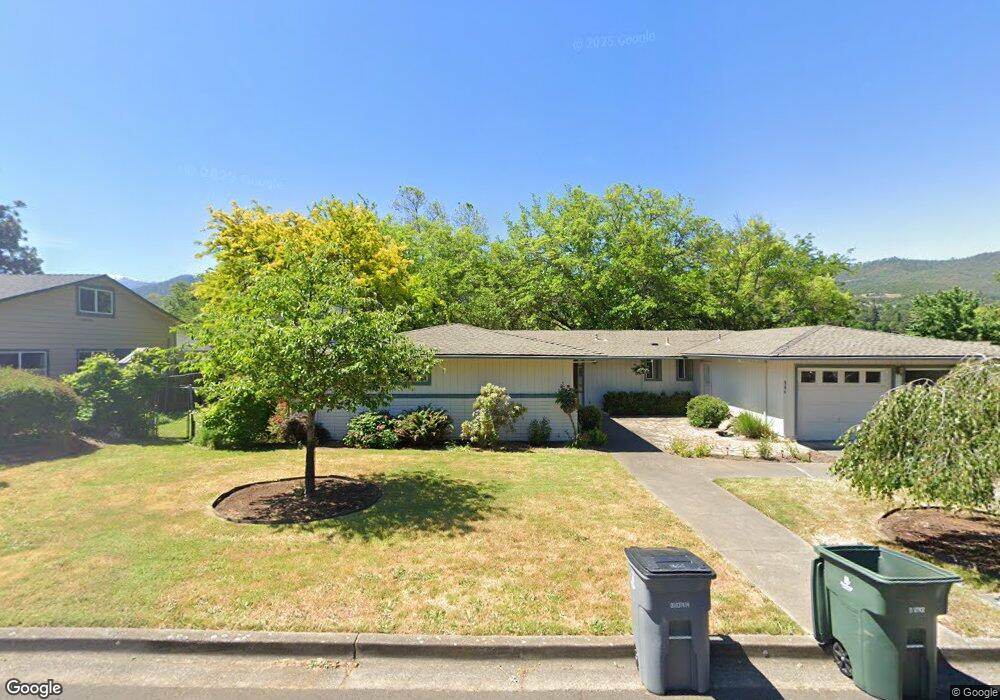
366 Tudor St Ashland, OR 97520
Quiet Village NeighborhoodEstimated Value: $532,584 - $592,000
3
Beds
4
Baths
2,050
Sq Ft
$275/Sq Ft
Est. Value
About This Home
This home is located at 366 Tudor St, Ashland, OR 97520 and is currently estimated at $564,146, approximately $275 per square foot. 366 Tudor St is a home located in Jackson County with nearby schools including Helman Elementary School, Ashland Middle School, and Ashland High School.
Ownership History
Date
Name
Owned For
Owner Type
Purchase Details
Closed on
Apr 30, 2010
Sold by
Morgan Janice M and Morgan Darold A
Bought by
Morgan Janice M and Morgan Darold A
Current Estimated Value
Purchase Details
Closed on
Oct 7, 2004
Sold by
Taylor Bob and Taylor Donna G
Bought by
Morgan Darold and Morgan Janice
Home Financials for this Owner
Home Financials are based on the most recent Mortgage that was taken out on this home.
Original Mortgage
$176,500
Interest Rate
5.77%
Mortgage Type
Purchase Money Mortgage
Purchase Details
Closed on
Dec 11, 2003
Sold by
Lee Robert E and Robert E Lee Revocable Living
Bought by
Taylor Bob and Taylor Donna G
Home Financials for this Owner
Home Financials are based on the most recent Mortgage that was taken out on this home.
Original Mortgage
$204,800
Interest Rate
6.02%
Mortgage Type
Purchase Money Mortgage
Purchase Details
Closed on
May 14, 2002
Sold by
Lee Robert E
Bought by
Lee Robert E and The Robert E Lee Revocable Living Trust
Create a Home Valuation Report for This Property
The Home Valuation Report is an in-depth analysis detailing your home's value as well as a comparison with similar homes in the area
Home Values in the Area
Average Home Value in this Area
Purchase History
| Date | Buyer | Sale Price | Title Company |
|---|---|---|---|
| Morgan Janice M | -- | Accommodation | |
| Morgan Darold | $372,500 | Lawyers Title Ins | |
| Taylor Bob | $256,000 | Lawyers Title Insurance Corp | |
| Lee Robert E | -- | -- |
Source: Public Records
Mortgage History
| Date | Status | Borrower | Loan Amount |
|---|---|---|---|
| Closed | Morgan Darold | $176,500 | |
| Previous Owner | Taylor Bob | $204,800 |
Source: Public Records
Tax History Compared to Growth
Tax History
| Year | Tax Paid | Tax Assessment Tax Assessment Total Assessment is a certain percentage of the fair market value that is determined by local assessors to be the total taxable value of land and additions on the property. | Land | Improvement |
|---|---|---|---|---|
| 2025 | $4,164 | $268,590 | $112,770 | $155,820 |
| 2024 | $4,164 | $260,770 | $109,480 | $151,290 |
| 2023 | $4,029 | $253,180 | $106,300 | $146,880 |
| 2022 | $3,900 | $253,180 | $106,300 | $146,880 |
| 2021 | $3,767 | $245,810 | $103,210 | $142,600 |
| 2020 | $3,661 | $238,660 | $100,210 | $138,450 |
| 2019 | $3,603 | $224,970 | $94,470 | $130,500 |
| 2018 | $3,404 | $218,420 | $91,720 | $126,700 |
| 2017 | $3,379 | $218,420 | $91,720 | $126,700 |
| 2016 | $3,291 | $205,890 | $86,460 | $119,430 |
| 2015 | $3,164 | $205,890 | $86,460 | $119,430 |
| 2014 | $3,061 | $194,080 | $81,500 | $112,580 |
Source: Public Records
Map
Nearby Homes
- 360 Coventry Place
- 472 Lindsay Ln
- 662 Vansant St
- 356 Randy St
- 364 Randy St
- 332 Randy St
- 566 Coffee Ln
- 595 Elizabeth Ave
- 106 Dunn Cir
- 242 Grant St
- 230 Grant St
- 720 Grover St
- 581 Scenic Dr Unit 9
- 323 Glenn St Unit 6
- 330 Glenn St
- 311 Glenn St Unit 3
- 166 Mountain View Dr
- 317 Maple St
- 384 Glenn St
- 67 Woolen Way