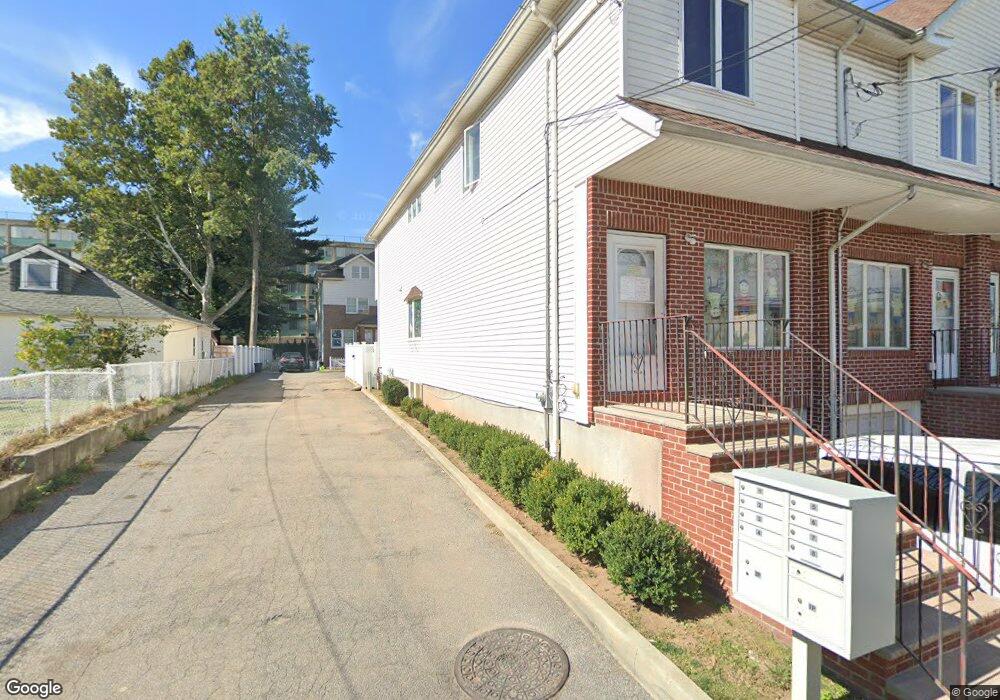
366 Union Ave Unit D1,2&E1,2 Staten Island, NY 10303
Mariners Harbor NeighborhoodEstimated Value: $531,200 - $605,000
10
Beds
6
Baths
5,000
Sq Ft
$115/Sq Ft
Est. Value
About This Home
This home is located at 366 Union Ave Unit D1,2&E1,2, Staten Island, NY 10303 and is currently estimated at $573,300, approximately $114 per square foot. 366 Union Ave Unit D1,2&E1,2 is a home located in Richmond County with nearby schools including P.S. 44 Thomas C Brown, I.S. 51 Edwin Markham, and Port Richmond High School.
Ownership History
Date
Name
Owned For
Owner Type
Purchase Details
Closed on
May 20, 2022
Sold by
187 Court Street Llc
Bought by
109 Chestnut Ridge Rd Llc
Current Estimated Value
Purchase Details
Closed on
Oct 13, 2017
Sold by
Rosario Caracci L L C
Bought by
187 Court Street L L C
Purchase Details
Closed on
Dec 9, 2016
Sold by
Chhc Llc
Bought by
Rosario Caracci Llc
Purchase Details
Closed on
Nov 29, 2005
Sold by
Chiang Shi Chau and Chiang Shichau
Bought by
Chhc Llc
Purchase Details
Closed on
Mar 2, 2004
Sold by
Mule Robin Savin
Bought by
Chiang Shichau
Home Financials for this Owner
Home Financials are based on the most recent Mortgage that was taken out on this home.
Original Mortgage
$239,200
Interest Rate
5%
Mortgage Type
Purchase Money Mortgage
Purchase Details
Closed on
Apr 18, 2001
Sold by
Weiland Leslie and Weiland Robert
Bought by
Mule Robin Savin
Home Financials for this Owner
Home Financials are based on the most recent Mortgage that was taken out on this home.
Original Mortgage
$80,500
Interest Rate
6.02%
Mortgage Type
Purchase Money Mortgage
Purchase Details
Closed on
May 4, 1995
Sold by
Totten Dorothy C
Bought by
Weiland Robert and Weiland Leslie
Create a Home Valuation Report for This Property
The Home Valuation Report is an in-depth analysis detailing your home's value as well as a comparison with similar homes in the area
Home Values in the Area
Average Home Value in this Area
Purchase History
| Date | Buyer | Sale Price | Title Company |
|---|---|---|---|
| 109 Chestnut Ridge Rd Llc | -- | -- | |
| 187 Court Street L L C | $400,000 | Plaza Island Abstract Llc | |
| Rosario Caracci Llc | $1,300,000 | None Available | |
| Chhc Llc | $226,291 | First Amer Title Ins Co Ny | |
| Chiang Shichau | $299,000 | Chicago Title Insurance Co | |
| Mule Robin Savin | $130,000 | Titleserv Inc | |
| Weiland Robert | -- | -- |
Source: Public Records
Mortgage History
| Date | Status | Borrower | Loan Amount |
|---|---|---|---|
| Previous Owner | Chiang Shichau | $239,200 | |
| Previous Owner | Mule Robin Savin | $80,500 |
Source: Public Records
Tax History Compared to Growth
Tax History
| Year | Tax Paid | Tax Assessment Tax Assessment Total Assessment is a certain percentage of the fair market value that is determined by local assessors to be the total taxable value of land and additions on the property. | Land | Improvement |
|---|---|---|---|---|
| 2025 | $4,495 | $33,960 | $3,688 | $30,272 |
| 2024 | $4,495 | $36,240 | $3,260 | $32,980 |
| 2023 | $4,545 | $22,378 | $3,498 | $18,880 |
| 2022 | $4,433 | $27,480 | $5,280 | $22,200 |
| 2021 | $4,409 | $25,980 | $5,280 | $20,700 |
| 2020 | $8,131 | $25,560 | $5,280 | $20,280 |
| 2019 | $3,901 | $26,460 | $5,280 | $21,180 |
| 2018 | $3,801 | $18,648 | $4,251 | $14,397 |
| 2017 | $3,773 | $18,507 | $4,092 | $14,415 |
| 2016 | $3,490 | $17,460 | $4,209 | $13,251 |
| 2015 | $2,982 | $16,472 | $3,866 | $12,606 |
| 2014 | $2,982 | $15,540 | $4,380 | $11,160 |
Source: Public Records
Map
Nearby Homes
- 331 Union Ave
- 22 Spirit Ln Unit 37
- 56 Confederation Place
- 22 Confederation Place
- 257 Maple Pkwy
- 268 Bruckner Ave Unit 268
- 336 van Name Ave
- 16 Union Ct
- 263 Lockman Ave
- 12 Doreen Dr
- 300 Andros Ave Unit A
- 414 Wilcox St
- 186 Union Ave
- 300A Andros Ave
- 21 Carol Place
- 38 Eleanor Place
- 49 Doreen Dr
- 51 Adrianne Ln
- 155 Dehart Ave
- 48 Adrianne Ln
- 366 Union Ave
- 366 Union Ave
- 366 Union Ave
- 366 Union Ave
- 366 Union Ave
- 366 Union Ave Unit B
- 366 Union Ave Unit C
- 366 Union Ave Unit E
- 366 Union Ave Unit A
- 366 Union Ave Unit D
- 366 Union Ave Unit A,B,C
- 366 Union Ave Unit 4
- 366 Union Ave Unit D1
- 358 Union Ave
- 370 Union Ave
- 356 Union Ave
- 372 Union Ave
- 354 Union Ave
- 352 Union Ave
- 376 Union Ave