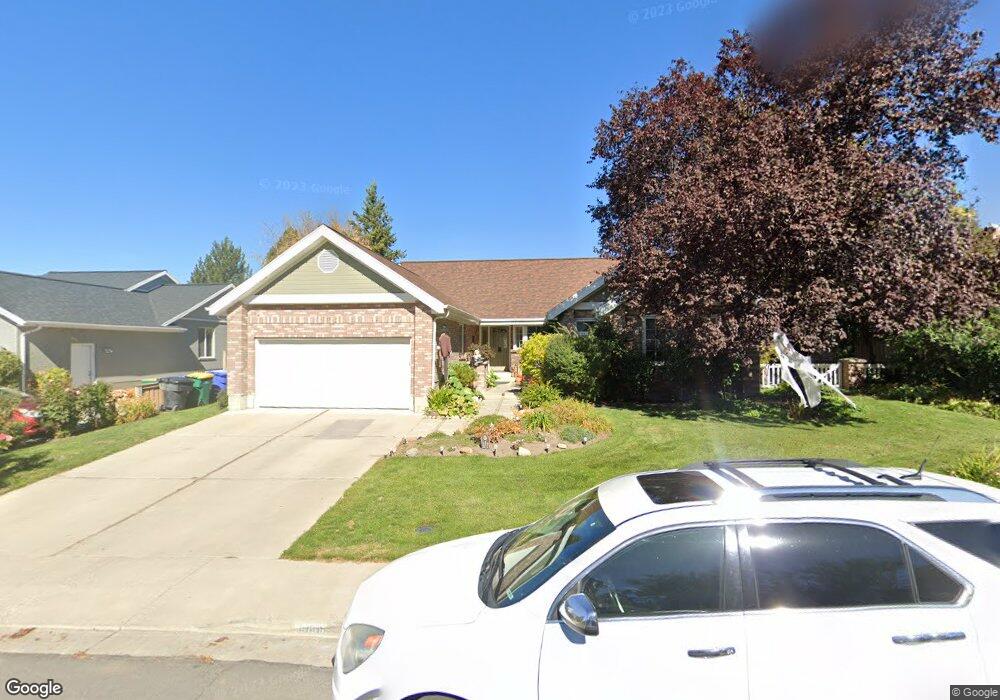
366 W 1800 S Orem, UT 84058
Lakeview NeighborhoodEstimated Value: $675,061 - $718,000
4
Beds
3
Baths
3,804
Sq Ft
$182/Sq Ft
Est. Value
About This Home
This home is located at 366 W 1800 S, Orem, UT 84058 and is currently estimated at $692,765, approximately $182 per square foot. 366 W 1800 S is a home located in Utah County with nearby schools including Westmore Elementary School, Lakeridge Jr High School, and Mountain View High School.
Ownership History
Date
Name
Owned For
Owner Type
Purchase Details
Closed on
Aug 28, 2008
Sold by
Rosenberg John Reed and Rosenberg Gaylamarie
Bought by
Gustaveson Sandra A and Swenson Mary B
Current Estimated Value
Home Financials for this Owner
Home Financials are based on the most recent Mortgage that was taken out on this home.
Original Mortgage
$292,815
Outstanding Balance
$192,417
Interest Rate
6.27%
Mortgage Type
FHA
Estimated Equity
$500,348
Purchase Details
Closed on
Aug 7, 2002
Sold by
Wilson Ralph M and Wilson Cornelia J
Bought by
Rosenberg John Reed and Rosenberg Gaylamarie
Home Financials for this Owner
Home Financials are based on the most recent Mortgage that was taken out on this home.
Original Mortgage
$119,000
Interest Rate
6.52%
Purchase Details
Closed on
Apr 19, 2000
Sold by
Hat Creek Country Estates Lc
Bought by
Wilson Ralph M and Wilson Cornelia J
Home Financials for this Owner
Home Financials are based on the most recent Mortgage that was taken out on this home.
Original Mortgage
$76,765
Interest Rate
8.24%
Create a Home Valuation Report for This Property
The Home Valuation Report is an in-depth analysis detailing your home's value as well as a comparison with similar homes in the area
Home Values in the Area
Average Home Value in this Area
Purchase History
| Date | Buyer | Sale Price | Title Company |
|---|---|---|---|
| Gustaveson Sandra A | -- | Affiliated First Title Comp | |
| Rosenberg John Reed | -- | Pro Title & Escrow Inc | |
| Wilson Ralph M | -- | Pro Title & Escrow Inc |
Source: Public Records
Mortgage History
| Date | Status | Borrower | Loan Amount |
|---|---|---|---|
| Open | Gustaveson Sandra A | $292,815 | |
| Previous Owner | Rosenberg John Reed | $119,000 | |
| Previous Owner | Wilson Ralph M | $76,765 |
Source: Public Records
Tax History Compared to Growth
Tax History
| Year | Tax Paid | Tax Assessment Tax Assessment Total Assessment is a certain percentage of the fair market value that is determined by local assessors to be the total taxable value of land and additions on the property. | Land | Improvement |
|---|---|---|---|---|
| 2025 | $2,688 | $348,425 | $232,700 | $400,800 |
| 2024 | $2,688 | $328,680 | $0 | $0 |
| 2023 | $2,527 | $332,145 | $0 | $0 |
| 2022 | $2,444 | $311,190 | $0 | $0 |
| 2021 | $2,277 | $439,200 | $181,800 | $257,400 |
| 2020 | $2,099 | $397,800 | $145,400 | $252,400 |
| 2019 | $2,018 | $397,800 | $145,400 | $252,400 |
| 2018 | $1,989 | $374,500 | $127,700 | $246,800 |
| 2017 | $1,861 | $187,715 | $0 | $0 |
| 2016 | $1,862 | $173,250 | $0 | $0 |
| 2015 | $1,757 | $154,605 | $0 | $0 |
| 2014 | $1,695 | $148,445 | $0 | $0 |
Source: Public Records
Map
Nearby Homes
- 467 W 1640 S
- 302 W Hidden Hollow Dr
- 537 W 1770 S
- 543 W 1770 S
- 1710 S 165 W
- 1676 S Lakewood Dr
- 515 W 1520 S Unit 3096
- 160 W Hidden Hollow Cir
- 139 W Hidden Hollow Dr
- 335 W 1410 S
- 1930 S 50 W
- 1874 S Main St
- 1550 S Main St
- 1707 S 50 E
- 1965 N 3050 W
- 1985 S Main St
- 74 Park Ln N
- 1679 N 2250 W
- 1469 S 110 E
- 1682 N 2250 W