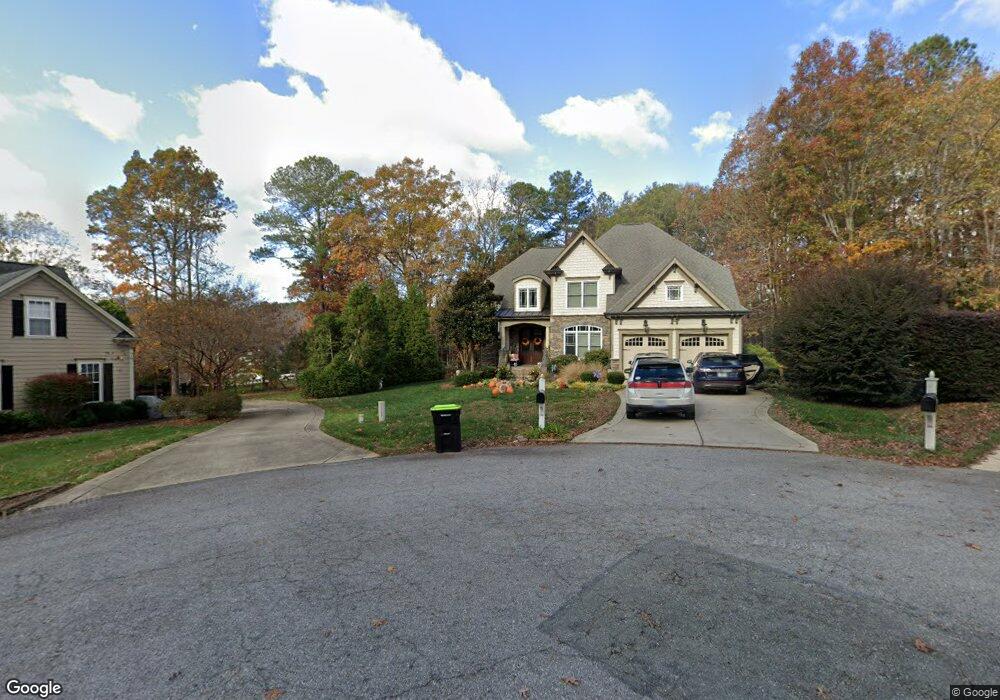
366 Windham Way Clayton, NC 27527
Estimated Value: $596,233 - $643,000
4
Beds
3
Baths
3,012
Sq Ft
$207/Sq Ft
Est. Value
About This Home
This home is located at 366 Windham Way, Clayton, NC 27527 and is currently estimated at $622,558, approximately $206 per square foot. 366 Windham Way is a home located in Johnston County with nearby schools including River Dell Elementary School, Archer Lodge Middle School, and Corinth Holders High School.
Ownership History
Date
Name
Owned For
Owner Type
Purchase Details
Closed on
Jun 24, 2021
Sold by
Ferrell Steve W and Gordon Becky Y
Bought by
Gordon Becky Y
Current Estimated Value
Purchase Details
Closed on
Sep 20, 2019
Sold by
Rasmussen Jean
Bought by
Gordon Becky Yvette and Ferrell Steve W
Home Financials for this Owner
Home Financials are based on the most recent Mortgage that was taken out on this home.
Original Mortgage
$335,500
Outstanding Balance
$293,872
Interest Rate
3.6%
Mortgage Type
New Conventional
Estimated Equity
$328,686
Purchase Details
Closed on
Dec 2, 2008
Sold by
Royalty Homes Inc
Bought by
Rasmussen Jean and Rasmussen Parley B
Purchase Details
Closed on
May 9, 2008
Sold by
Neuse Park Development Llc
Bought by
Royalty Homes Inc
Create a Home Valuation Report for This Property
The Home Valuation Report is an in-depth analysis detailing your home's value as well as a comparison with similar homes in the area
Home Values in the Area
Average Home Value in this Area
Purchase History
| Date | Buyer | Sale Price | Title Company |
|---|---|---|---|
| Gordon Becky Y | -- | None Available | |
| Gordon Becky Yvette | $435,500 | None Available | |
| Rasmussen Jean | $434,500 | None Available | |
| Royalty Homes Inc | $50,000 | None Available |
Source: Public Records
Mortgage History
| Date | Status | Borrower | Loan Amount |
|---|---|---|---|
| Open | Gordon Becky Yvette | $335,500 |
Source: Public Records
Tax History Compared to Growth
Tax History
| Year | Tax Paid | Tax Assessment Tax Assessment Total Assessment is a certain percentage of the fair market value that is determined by local assessors to be the total taxable value of land and additions on the property. | Land | Improvement |
|---|---|---|---|---|
| 2025 | $3,855 | $607,070 | $95,000 | $512,070 |
| 2024 | $3,372 | $416,340 | $77,500 | $338,840 |
| 2023 | $3,372 | $416,340 | $77,500 | $338,840 |
| 2022 | $3,414 | $416,340 | $77,500 | $338,840 |
| 2021 | $3,414 | $416,340 | $77,500 | $338,840 |
| 2020 | $3,539 | $416,340 | $77,500 | $338,840 |
| 2019 | $3,539 | $416,340 | $77,500 | $338,840 |
| 2018 | $3,364 | $386,710 | $60,000 | $326,710 |
| 2017 | $3,287 | $386,710 | $60,000 | $326,710 |
| 2016 | $3,287 | $386,710 | $60,000 | $326,710 |
| 2015 | $3,287 | $386,710 | $60,000 | $326,710 |
| 2014 | $3,287 | $386,710 | $60,000 | $326,710 |
Source: Public Records
Map
Nearby Homes
- 303 Ashley Woods Ct
- 592 W Walker Woods Ln
- Huntley Plan at Copper Ridge at Flowers Plantation
- Winslow Plan at Copper Ridge at Flowers Plantation
- Riley Plan at Copper Ridge at Flowers Plantation
- TA4000 Plan at Copper Ridge at Flowers Plantation
- Wakefield Plan at Copper Ridge at Flowers Plantation
- Calgary Plan at Copper Ridge at Flowers Plantation
- TA2300 Plan at Copper Ridge at Flowers Plantation
- Abigale Plan at Copper Ridge at Flowers Plantation
- Devin Plan at Copper Ridge at Flowers Plantation
- Kipling Plan at Copper Ridge at Flowers Plantation
- Wayne Plan at Copper Ridge at Flowers Plantation
- TA3000 Plan at Copper Ridge at Flowers Plantation
- Bayside Plan at Copper Ridge at Flowers Plantation
- Cyprus Plan at Copper Ridge at Flowers Plantation
- 58 Manor Stone Dr Unit 329
- 94 Silent Bend Dr Unit 246
- 104 Silent Bend Dr Unit 245
- 95 Silent Bend Dr Unit 263p
- 376 Windham Way
- 73 Stewarts Knob Dr
- 55 Stewarts Knob Dr
- 37 Stewarts Knob Dr
- 25 Stewarts Knob Dr
- 97 Stewarts Knob Dr
- 350 Windham Way
- 124 E Tauchers Path
- 112 E Tauchers Path Unit 27 Barrett Plan
- 112 E Tauchers Path
- 322 Windham Way
- 341 Windham Way
- 188 E Walker Woods Ln
- 206 E Walker Woods Ln
- 123 E Tauchers Path
- 240 E Walker Woods Ln
- 168 E Walker Woods Ln
- 94 E Tauchers Path
- 94 E Tauchers Path Unit 28 Cabot 2
- 103 E Tauchers Path Unit 24