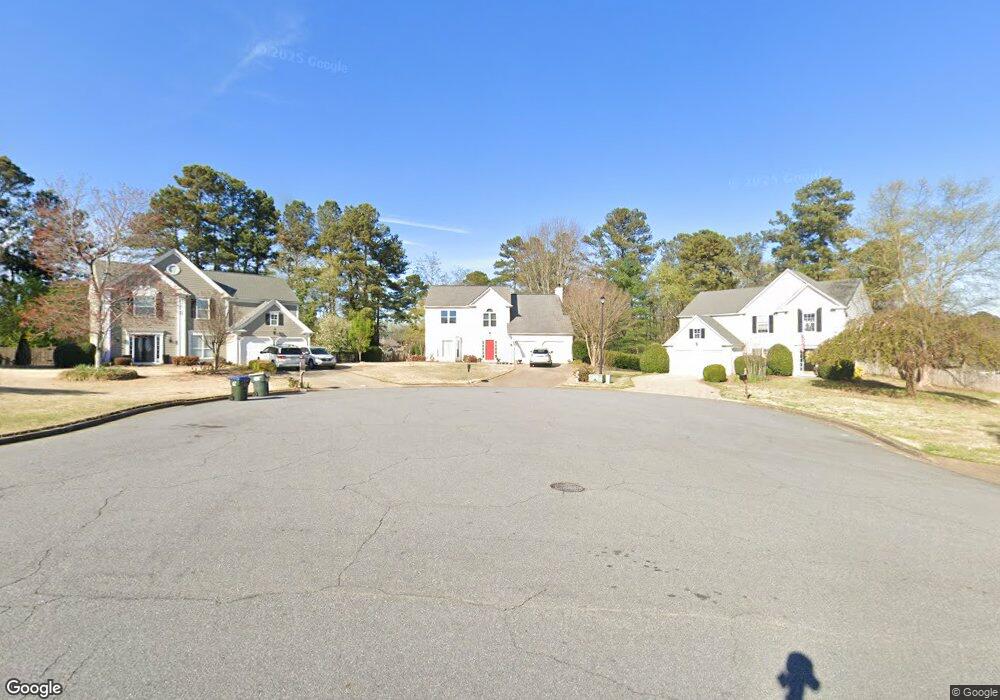
3660 Bardfield Ct Cumming, GA 30041
Estimated Value: $579,000 - $604,000
4
Beds
3
Baths
2,178
Sq Ft
$271/Sq Ft
Est. Value
About This Home
This home is located at 3660 Bardfield Ct, Cumming, GA 30041 and is currently estimated at $590,969, approximately $271 per square foot. 3660 Bardfield Ct is a home located in Forsyth County with nearby schools including Brookwood Elementary School, South Forsyth Middle School, and Lambert High School.
Ownership History
Date
Name
Owned For
Owner Type
Purchase Details
Closed on
May 30, 2014
Sold by
Rickman James A
Bought by
Randolph Melanie
Current Estimated Value
Home Financials for this Owner
Home Financials are based on the most recent Mortgage that was taken out on this home.
Original Mortgage
$216,117
Outstanding Balance
$161,555
Interest Rate
3.75%
Mortgage Type
FHA
Estimated Equity
$429,414
Purchase Details
Closed on
Feb 25, 2002
Sold by
Stevens Casey W
Bought by
Stevens Kristen G
Home Financials for this Owner
Home Financials are based on the most recent Mortgage that was taken out on this home.
Original Mortgage
$122,712
Interest Rate
6.85%
Mortgage Type
New Conventional
Purchase Details
Closed on
Aug 25, 1995
Sold by
Pulte Home Corp
Bought by
Stevens Casey Kristen
Create a Home Valuation Report for This Property
The Home Valuation Report is an in-depth analysis detailing your home's value as well as a comparison with similar homes in the area
Home Values in the Area
Average Home Value in this Area
Purchase History
| Date | Buyer | Sale Price | Title Company |
|---|---|---|---|
| Randolph Melanie | $236,000 | -- | |
| Stevens Kristen G | -- | -- | |
| Stevens Casey Kristen | $144,400 | -- |
Source: Public Records
Mortgage History
| Date | Status | Borrower | Loan Amount |
|---|---|---|---|
| Open | Randolph Melanie | $216,117 | |
| Previous Owner | Stevens Kristen G | $122,712 |
Source: Public Records
Tax History Compared to Growth
Tax History
| Year | Tax Paid | Tax Assessment Tax Assessment Total Assessment is a certain percentage of the fair market value that is determined by local assessors to be the total taxable value of land and additions on the property. | Land | Improvement |
|---|---|---|---|---|
| 2025 | $4,066 | $222,120 | $78,000 | $144,120 |
| 2024 | $4,066 | $208,364 | $68,000 | $140,364 |
| 2023 | $3,507 | $195,728 | $60,000 | $135,728 |
| 2022 | $3,441 | $120,928 | $40,000 | $80,928 |
| 2021 | $2,947 | $120,928 | $40,000 | $80,928 |
| 2020 | $2,933 | $120,268 | $40,000 | $80,268 |
| 2019 | $2,849 | $115,964 | $40,000 | $75,964 |
| 2018 | $2,653 | $105,864 | $30,000 | $75,864 |
| 2017 | $2,393 | $93,068 | $30,000 | $63,068 |
| 2016 | $2,355 | $91,268 | $30,000 | $61,268 |
| 2015 | $2,252 | $86,228 | $30,000 | $56,228 |
| 2014 | $1,933 | $77,528 | $0 | $0 |
Source: Public Records
Map
Nearby Homes
- 3115 Arbor Song Ct
- 3585 Lakeheath Dr
- 3715 Lakeheath Dr
- 3730 Lakeheath Dr
- 3250 Caney Estates Place
- 7530 Newstead Dr
- 4020 Bridle Ridge Dr
- 3150 Thistle Trail
- 3180 Caney Creek Ln
- 7170 Collingsworth Place
- 7105 Brookwood Way
- 2875 Caney Rd
- 3030 Brookwater Dr Unit 1
- 3055 Rocky Brook Dr
- 3070 Brookwater Dr
- 2005 Brook Meadow Dr
- 7045 Harlech Trace
- 3820 Ridge Point Dr
- 2940 Bentbill Crossing
- 3650 Bardfield Ct
- 3670 Bardfield Ct
- 3680 Bardfield Ct
- 3640 Bardfield Ct
- 2940 Arbor Vine Way
- 3010 Arbor Vine Way
- 2930 Arbor Vine Way
- 3690 Bardfield Ct Unit 5
- 3020 Arbor Vine Way
- 2920 Arbor Vine Way
- 3025 Raskarity Rd
- 3685 Bardfield Ct Unit IV
- 3645 Bardfield Ct
- 3630 Bardfield Ct
- 3040 Arbor Vine Way
- 2910 Arbor Vine Way
- 2913 Brookwood Rd
- 3710 Bardfield Ct
- 3050 Arbor Vine Way
- 3695 Bardfield Ct