Estimated Value: $224,000 - $296,000
4
Beds
3
Baths
1,718
Sq Ft
$153/Sq Ft
Est. Value
About This Home
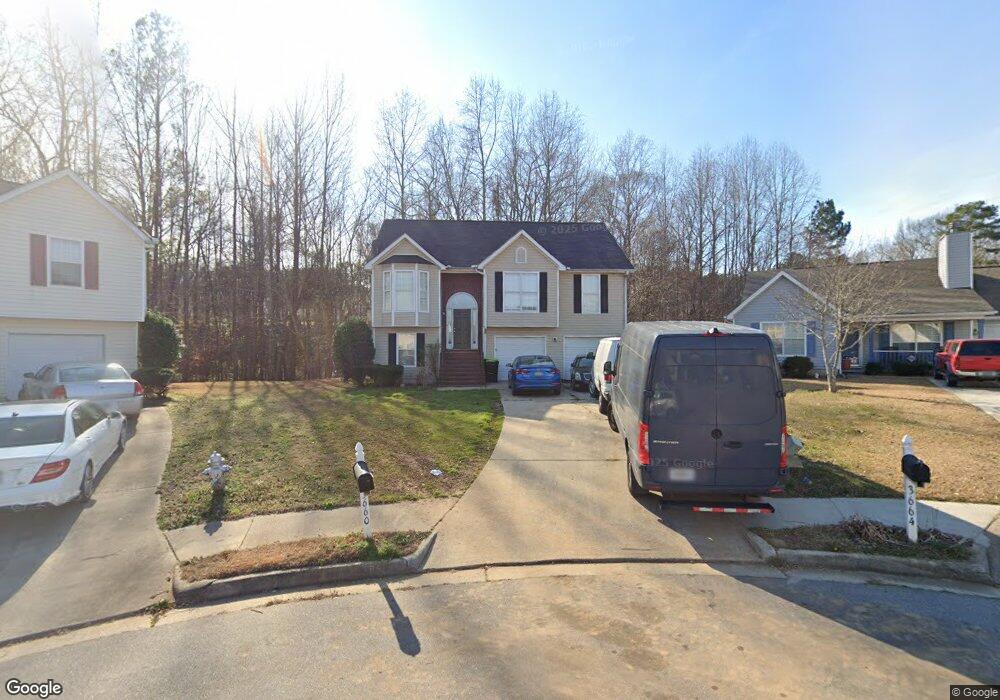
This home is located at 3660 Hudson Way Unit 3660, Rex, GA 30273 and is currently estimated at $263,022, approximately $153 per square foot. 3660 Hudson Way Unit 3660 is a home located in Clayton County with nearby schools including Roberta T. Smith Elementary School, Rex Mill Middle School, and Mount Zion High School.
Ownership History
Date
Name
Owned For
Owner Type
Purchase Details
Closed on
Aug 5, 2016
Sold by
Astor Atl Llc
Bought by
Laf Go Llc
Current Estimated Value
Purchase Details
Closed on
Jul 7, 2015
Sold by
Cummings Michael Dewayne
Bought by
Astor Atl Llc
Purchase Details
Closed on
Apr 9, 2002
Sold by
James Jenna A
Bought by
Cummings Michael D and Cummings Felicia Y
Home Financials for this Owner
Home Financials are based on the most recent Mortgage that was taken out on this home.
Original Mortgage
$140,790
Interest Rate
6.89%
Mortgage Type
New Conventional
Purchase Details
Closed on
Oct 5, 2000
Sold by
Knight Group Inc
Bought by
James Jenna A
Home Financials for this Owner
Home Financials are based on the most recent Mortgage that was taken out on this home.
Original Mortgage
$121,895
Interest Rate
7.96%
Mortgage Type
FHA
Create a Home Valuation Report for This Property
The Home Valuation Report is an in-depth analysis detailing your home's value as well as a comparison with similar homes in the area
Home Values in the Area
Average Home Value in this Area
Purchase History
| Date | Buyer | Sale Price | Title Company |
|---|---|---|---|
| Laf Go Llc | -- | -- | |
| Astor Atl Llc | $68,500 | -- | |
| Cummings Michael D | $143,000 | -- | |
| James Jenna A | $122,900 | -- |
Source: Public Records
Mortgage History
| Date | Status | Borrower | Loan Amount |
|---|---|---|---|
| Previous Owner | Cummings Michael D | $140,790 | |
| Previous Owner | James Jenna A | $121,895 |
Source: Public Records
Tax History Compared to Growth
Tax History
| Year | Tax Paid | Tax Assessment Tax Assessment Total Assessment is a certain percentage of the fair market value that is determined by local assessors to be the total taxable value of land and additions on the property. | Land | Improvement |
|---|---|---|---|---|
| 2025 | $4,404 | $114,000 | $7,980 | $106,020 |
| 2024 | $4,485 | $117,480 | $8,800 | $108,680 |
| 2023 | $3,945 | $108,200 | $8,800 | $99,400 |
| 2022 | $3,322 | $83,680 | $8,800 | $74,880 |
| 2021 | $2,777 | $69,360 | $8,800 | $60,560 |
| 2020 | $2,429 | $59,776 | $8,800 | $50,976 |
| 2019 | $2,204 | $53,355 | $6,400 | $46,955 |
| 2018 | $1,785 | $43,042 | $6,400 | $36,642 |
| 2017 | $1,525 | $36,554 | $6,400 | $30,154 |
| 2016 | $1,153 | $27,400 | $6,400 | $21,000 |
| 2015 | $1,157 | $0 | $0 | $0 |
| 2014 | $816 | $29,539 | $6,400 | $23,139 |
Source: Public Records
Map
Nearby Homes
- 3700 Hudson Ct
- 3601 Bristol Overlook
- 7027 Biscayne Blvd
- 3535 Henley St
- 0 Lakeland Rd Unit 7648836
- 0 Lakeland Rd Unit 10603417
- 6870 Diamond Dr
- 6891 Dresden Dr
- 6674 Sunset Valley Cir
- 6750 Sunset Hills Blvd
- 6716 Teresa Ln
- 3552 Topaz Terrace
- 7106 Oakwood Cir Unit 1
- 6603 Biscayne Blvd
- 6710 Sunset Hills Blvd
- 3403 Hidden Ln
- 6646 Creek Turn Dr
- 3920 Augustine Place
- 3824 Augustine Place
- 3374 Creekwood Dr
- 3660 Hudson Way
- 3660 Hudson Way
- 3664 Hudson Way
- 3661 Hudson Way
- 3668 Hudson Way Unit 4
- 3665 Hudson Way
- 3674 Hudson Way
- 3673 Hudson Way Unit 4
- 3679 Hudson Way
- 3680 Hudson Way Unit 4
- 3598 Bristol Overlook
- 3682 Bristol Overlook
- 3682 Bristol Overlook Unit 5
- 3602 Bristol Overlook Unit 6
- 3688 Bristol Overlook
- 3610 Bristol Overlook
- 3662 Bristol Overlook Unit 149
- 3662 Bristol Overlook
- 3685 Hudson Way
- 3594 Bristol Overlook