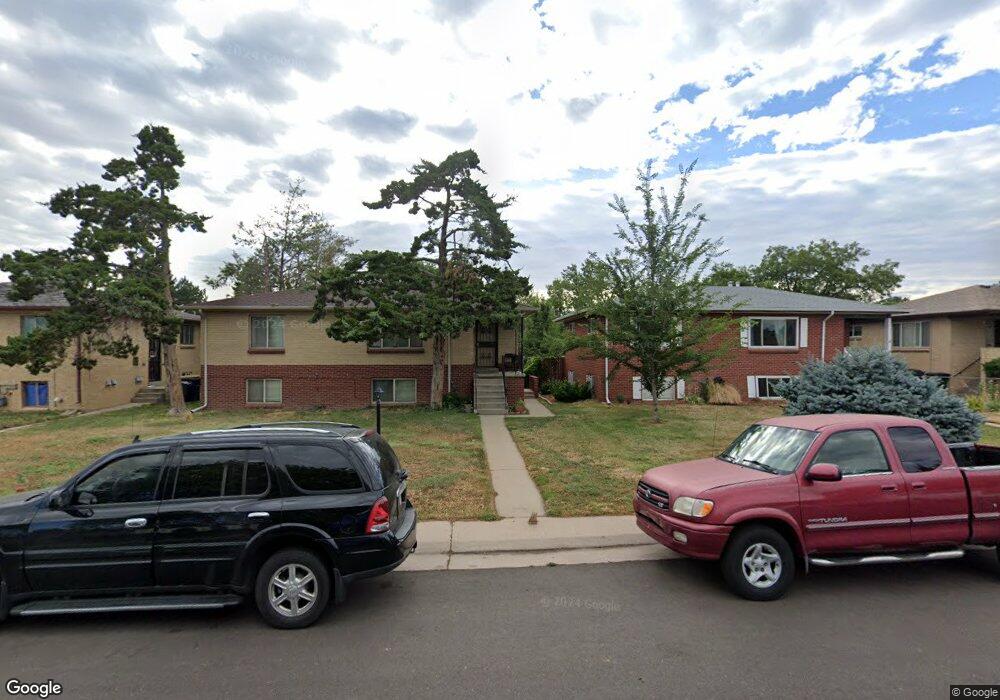
3660 Locust St Denver, CO 80207
Northeast Park Hill NeighborhoodEstimated Value: $501,178 - $581,000
4
Beds
2
Baths
1,828
Sq Ft
$296/Sq Ft
Est. Value
About This Home
This home is located at 3660 Locust St, Denver, CO 80207 and is currently estimated at $541,089, approximately $296 per square foot. 3660 Locust St is a home located in Denver County with nearby schools including Margaret M Smith Elementary School, William (Bill) Roberts ECE-8 School, and Denver Discovery School.
Ownership History
Date
Name
Owned For
Owner Type
Purchase Details
Closed on
May 19, 2014
Sold by
Hunsicker Jeffrey W and Hunsicker Elizabeth Y
Bought by
Woodson Sheryl J
Current Estimated Value
Home Financials for this Owner
Home Financials are based on the most recent Mortgage that was taken out on this home.
Original Mortgage
$236,634
Outstanding Balance
$180,814
Interest Rate
4.4%
Mortgage Type
FHA
Estimated Equity
$360,275
Purchase Details
Closed on
Jul 15, 2009
Sold by
J Force Enterprises Llc
Bought by
Ihome Property Solutions Inc
Purchase Details
Closed on
Jun 18, 2009
Sold by
Meeks Brandis
Bought by
J Force Enterprises Llc
Purchase Details
Closed on
Apr 8, 2009
Sold by
Lasalle Bank National Association
Bought by
Meeks Brandis
Purchase Details
Closed on
Oct 14, 2008
Sold by
Franklin William Durando and Franklin Marsha M
Bought by
Lasalle Bank Na
Create a Home Valuation Report for This Property
The Home Valuation Report is an in-depth analysis detailing your home's value as well as a comparison with similar homes in the area
Home Values in the Area
Average Home Value in this Area
Purchase History
| Date | Buyer | Sale Price | Title Company |
|---|---|---|---|
| Woodson Sheryl J | $241,000 | Heritage Title | |
| Ihome Property Solutions Inc | $110,000 | Vista Title Llc | |
| J Force Enterprises Llc | $90,000 | Vista Title Llc | |
| Meeks Brandis | $83,000 | Chicago Title Co | |
| Lasalle Bank Na | -- | None Available |
Source: Public Records
Mortgage History
| Date | Status | Borrower | Loan Amount |
|---|---|---|---|
| Open | Woodson Sheryl J | $236,634 |
Source: Public Records
Tax History Compared to Growth
Tax History
| Year | Tax Paid | Tax Assessment Tax Assessment Total Assessment is a certain percentage of the fair market value that is determined by local assessors to be the total taxable value of land and additions on the property. | Land | Improvement |
|---|---|---|---|---|
| 2024 | $3,624 | $45,760 | $8,870 | $36,890 |
| 2023 | $3,546 | $45,760 | $8,870 | $36,890 |
| 2022 | $2,217 | $27,880 | $8,490 | $19,390 |
| 2021 | $2,187 | $29,310 | $8,930 | $20,380 |
| 2020 | $2,141 | $28,860 | $8,930 | $19,930 |
| 2019 | $2,081 | $28,860 | $8,930 | $19,930 |
| 2018 | $1,668 | $21,560 | $5,850 | $15,710 |
| 2017 | $1,663 | $21,560 | $5,850 | $15,710 |
| 2016 | $1,498 | $18,370 | $5,970 | $12,400 |
| 2015 | $1,435 | $18,370 | $5,970 | $12,400 |
| 2014 | $1,175 | $14,150 | $3,980 | $10,170 |
Source: Public Records
Map
Nearby Homes
- 3690 Leyden St
- 3670 Magnolia St
- 3625 Kearney St
- 3675 Niagara St
- 3685 Jasmine St
- 3540 Niagara St
- 3360 Magnolia St
- 3327 Krameria St Unit ABC
- 3327 Krameria St
- 3398 Newport St
- 3285 N Monaco Street Pkwy
- 3269 Krameria St
- 3610 Olive St
- 3550 Holly St
- 3820 Olive St Unit 2
- 6335 Martin Luther King Junior Blvd
- 3311 Oneida St
- 6325 Martin Luther King Junior Blvd
- 3221 Krameria St
- 3536 Olive St
- 3652 Locust St
- 3670 Locust St
- 3680 Locust St
- 3644 Locust St
- 3690 Locust St
- 3640 Locust St
- 3659 Monaco Pkwy
- 3667 Monaco Pkwy
- 3669 Locust St
- 3651 Monaco Pkwy
- 3675 Locust St
- 3653 Locust St
- 3653 Locust St
- 3655 N Locust St
- 3679 Monaco Pkwy
- 3647 Locust St
- 3655 Locust St
- 3683 Monaco Pkwy
- 3685 Locust St
- 3630 Locust St