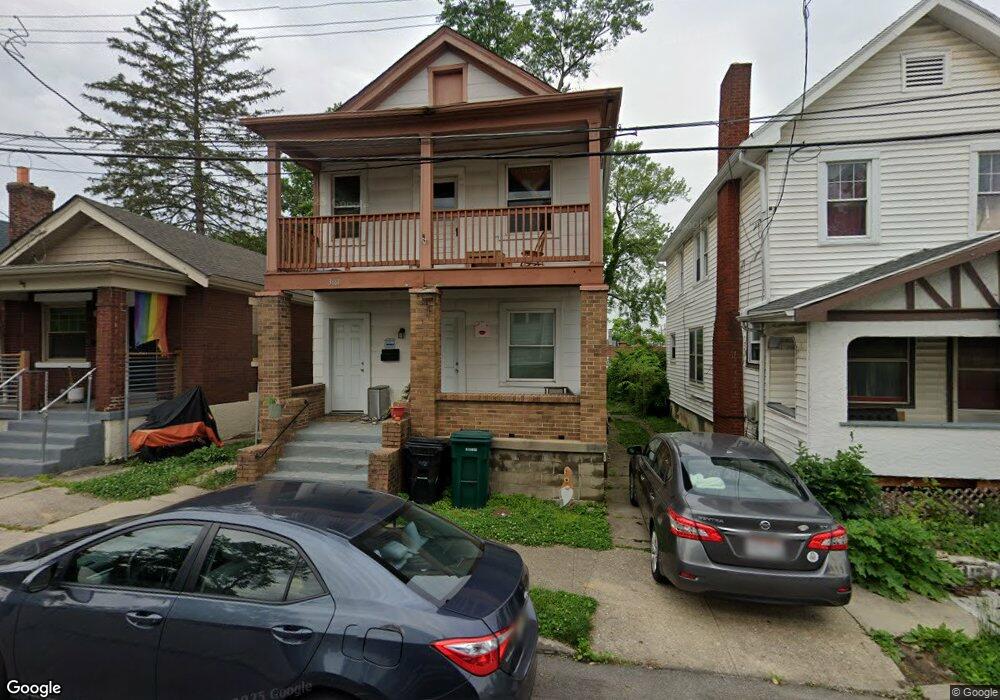
3661 Clarion Ave Cincinnati, OH 45207
Evanston NeighborhoodEstimated Value: $175,921 - $252,000
4
Beds
2
Baths
1,680
Sq Ft
$129/Sq Ft
Est. Value
About This Home
This home is located at 3661 Clarion Ave, Cincinnati, OH 45207 and is currently estimated at $216,730, approximately $129 per square foot. 3661 Clarion Ave is a home located in Hamilton County with nearby schools including Evanston Academy Elementary School, Clark Montessori High School, and Shroder High School.
Ownership History
Date
Name
Owned For
Owner Type
Purchase Details
Closed on
Mar 24, 2025
Sold by
Huff Doug
Bought by
3661 Clarion Llc
Current Estimated Value
Purchase Details
Closed on
May 21, 2015
Sold by
Ballew Sikia and Ballew Tyrone
Bought by
Huff Doug
Purchase Details
Closed on
Jan 18, 2007
Sold by
Odell Joy D
Bought by
Ballew Sikia
Home Financials for this Owner
Home Financials are based on the most recent Mortgage that was taken out on this home.
Original Mortgage
$73,841
Interest Rate
6.21%
Mortgage Type
FHA
Purchase Details
Closed on
Sep 9, 1998
Sold by
Miller John H Tr & Luebbert Timothy P
Bought by
Odell Joy D and The Joy D Odell Trust Agreement
Purchase Details
Closed on
Oct 31, 1996
Sold by
Lamb Patricia A and Rudman Peggy A
Bought by
Miller John H and Luebbert Timothy P
Home Financials for this Owner
Home Financials are based on the most recent Mortgage that was taken out on this home.
Original Mortgage
$45,600
Interest Rate
8.23%
Create a Home Valuation Report for This Property
The Home Valuation Report is an in-depth analysis detailing your home's value as well as a comparison with similar homes in the area
Home Values in the Area
Average Home Value in this Area
Purchase History
| Date | Buyer | Sale Price | Title Company |
|---|---|---|---|
| 3661 Clarion Llc | -- | None Listed On Document | |
| 3661 Clarion Llc | -- | None Listed On Document | |
| Huff Doug | $45,100 | Stewart Title Company | |
| Ballew Sikia | $75,000 | Attorney | |
| Odell Joy D | -- | -- | |
| Miller John H | $57,000 | -- |
Source: Public Records
Mortgage History
| Date | Status | Borrower | Loan Amount |
|---|---|---|---|
| Previous Owner | Ballew Sikia | $73,841 | |
| Previous Owner | Miller John H | $45,600 |
Source: Public Records
Tax History
| Year | Tax Paid | Tax Assessment Tax Assessment Total Assessment is a certain percentage of the fair market value that is determined by local assessors to be the total taxable value of land and additions on the property. | Land | Improvement |
|---|---|---|---|---|
| 2025 | $2,318 | $34,129 | $4,235 | $29,894 |
| 2024 | $2,165 | $34,129 | $4,235 | $29,894 |
| 2023 | $2,169 | $34,129 | $4,235 | $29,894 |
| 2022 | $1,219 | $17,207 | $3,693 | $13,514 |
| 2021 | $1,196 | $17,207 | $3,693 | $13,514 |
| 2020 | $1,200 | $17,207 | $3,693 | $13,514 |
| 2019 | $1,210 | $15,785 | $3,388 | $12,397 |
| 2018 | $1,211 | $15,785 | $3,388 | $12,397 |
| 2017 | $1,166 | $15,785 | $3,388 | $12,397 |
| 2016 | $1,279 | $16,920 | $3,525 | $13,395 |
| 2015 | $1,144 | $16,920 | $3,525 | $13,395 |
| 2014 | $1,150 | $16,920 | $3,525 | $13,395 |
| 2013 | $1,073 | $16,268 | $3,388 | $12,880 |
Source: Public Records
Map
Nearby Homes
- 3625 Newton Ave
- 3615 Newton Ave
- 3612 Idlewild Ave
- 3556 Woodburn Ave
- 1608 Brewster Ave
- 1606 Brewster Ave
- 1527 Dana Ave
- 1627 Jonathan Ave
- 3472 Woodburn Ave
- 3443 Montgomery Rd
- 3628 Bevis Ave
- 3572 Bevis Ave
- 3520 Trimble Ave
- 3507 Bevis Ave
- 2002 Clarion Ave
- 3514 Bevis Ave
- 2014 Clarion Ave
- 3629 Evanston Ave
- 3533 Evanston Ave
- 3460 Bevis Ave
- 3659 Clarion Ave
- 3663 Clarion Ave
- 3657 Clarion Ave
- 3665 Clarion Ave
- 1719 Dana Ave
- 3655 Clarion Ave
- 1721 Dana Ave
- 3653 Clarion Ave
- 1723 Dana Ave
- 3630 Newton Ave
- 1725 Dana Ave
- 3644 Clarion Ave
- 1727 Dana Ave
- 3642 Clarion Ave
- 3638 Clarion Ave
- 1729 Dana Ave
- 3637 Clarion Ave
- 1745 Dana Ave
- 3635 Newton Ave
- 3633 Newton Ave
Your Personal Tour Guide
Ask me questions while you tour the home.