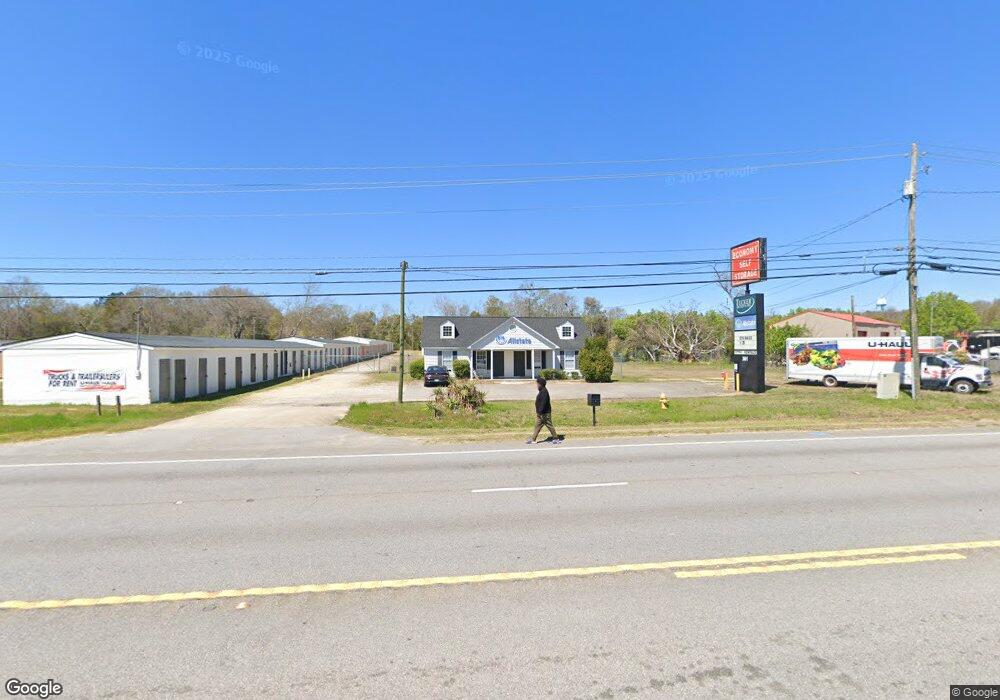
3661 Peach Orchard Rd Unit B Augusta, GA 30906
Richmond Factory NeighborhoodEstimated Value: $1,183,437
--
Bed
--
Bath
2,310
Sq Ft
$512/Sq Ft
Est. Value
About This Home
This home is located at 3661 Peach Orchard Rd Unit B, Augusta, GA 30906 and is currently estimated at $1,183,437, approximately $512 per square foot. 3661 Peach Orchard Rd Unit B is a home located in Richmond County with nearby schools including Diamond Lakes Elementary School, Pine Hill Middle School, and Johnson Magnet.
Ownership History
Date
Name
Owned For
Owner Type
Purchase Details
Closed on
Jul 2, 2025
Sold by
Buyside Capital Advisors Llc
Bought by
White Oak Assets Llc
Current Estimated Value
Purchase Details
Closed on
Aug 21, 2023
Sold by
Lockwood Investment Group Llc
Bought by
Buyside Capital Advisors Llc
Purchase Details
Closed on
Jul 18, 2022
Sold by
Tucker Heather B
Bought by
Cook Amy Williams
Home Financials for this Owner
Home Financials are based on the most recent Mortgage that was taken out on this home.
Original Mortgage
$230,000
Interest Rate
4.81%
Mortgage Type
New Conventional
Purchase Details
Closed on
Aug 28, 2008
Sold by
Felder James R
Bought by
Tucker Heather B and Tucker Brian W
Home Financials for this Owner
Home Financials are based on the most recent Mortgage that was taken out on this home.
Original Mortgage
$355,179
Interest Rate
6.61%
Create a Home Valuation Report for This Property
The Home Valuation Report is an in-depth analysis detailing your home's value as well as a comparison with similar homes in the area
Home Values in the Area
Average Home Value in this Area
Purchase History
| Date | Buyer | Sale Price | Title Company |
|---|---|---|---|
| White Oak Assets Llc | $100,000 | -- | |
| Buyside Capital Advisors Llc | $1,145,000 | -- | |
| Lockwood Investment Group Llc | $950,000 | -- | |
| Cook Amy Williams | $230,000 | -- | |
| Tucker Heather B | $350,000 | None Available |
Source: Public Records
Mortgage History
| Date | Status | Borrower | Loan Amount |
|---|---|---|---|
| Previous Owner | Cook Amy Williams | $230,000 | |
| Previous Owner | Tucker Heather B | $355,179 |
Source: Public Records
Tax History Compared to Growth
Tax History
| Year | Tax Paid | Tax Assessment Tax Assessment Total Assessment is a certain percentage of the fair market value that is determined by local assessors to be the total taxable value of land and additions on the property. | Land | Improvement |
|---|---|---|---|---|
| 2025 | $4,323 | $149,870 | $24,560 | $125,310 |
| 2024 | $4,323 | $111,276 | $24,560 | $86,716 |
| 2023 | $3,080 | $92,000 | $20,320 | $71,680 |
| 2022 | $4,034 | $140,222 | $24,560 | $115,662 |
| 2021 | $3,728 | $103,526 | $24,560 | $78,966 |
| 2020 | $2,799 | $103,526 | $24,560 | $78,966 |
| 2019 | $3,457 | $103,526 | $24,560 | $78,966 |
| 2018 | $3,316 | $102,233 | $24,560 | $77,673 |
| 2017 | $0 | $102,233 | $24,560 | $77,673 |
| 2016 | $3,319 | $102,233 | $24,560 | $77,673 |
| 2015 | -- | $102,233 | $24,560 | $77,673 |
| 2014 | -- | $102,233 | $24,560 | $77,673 |
Source: Public Records
Map
Nearby Homes
- 2427 Faith Trail
- 3908 Byrd Rd
- 2423 Ramblewood Dr
- 4349 White Pines Ct
- 2110 Travis Rd
- 2106 Boykin Rd
- 2114 Boykin Rd
- 249 Red Haven Ct
- 3637 Stanton Ct
- 2377 Tobacco Rd
- 2375 Tobacco Rd
- 2219 Travis Rd
- 245 Red Haven Ct
- 4310 Sanderling Dr
- 244 Red Haven Ct
- 3388 Thames Place
- Porter II Plan at Wedgewood
- Julie II Plan at Wedgewood
- Devonshire ll Plan at Wedgewood
- Benton II Plan at Wedgewood
- 3667 Peach
- 3667 Peach Orchard Rd
- 3663 Peach Orchard Rd
- 3659 Byrd Rd
- 3601 Cemetery Rd
- 3674 Peach Orchard Rd
- 3655 Byrd Rd
- 3676 Peach Orchard Rd
- 3642 Byrd Rd
- 3644 Byrd Rd
- 3611 Cemetery Rd
- 3653 Byrd Rd
- 3613 Cemetery Rd
- 3651 Byrd Rd
- 3654 Byrd Rd
- 3649 Byrd Rd
- 3636 Byrd Rd
- 3688 Peach Orchard Rd
- 3650 Byrd Rd
- 3695 Peach Orchard Rd