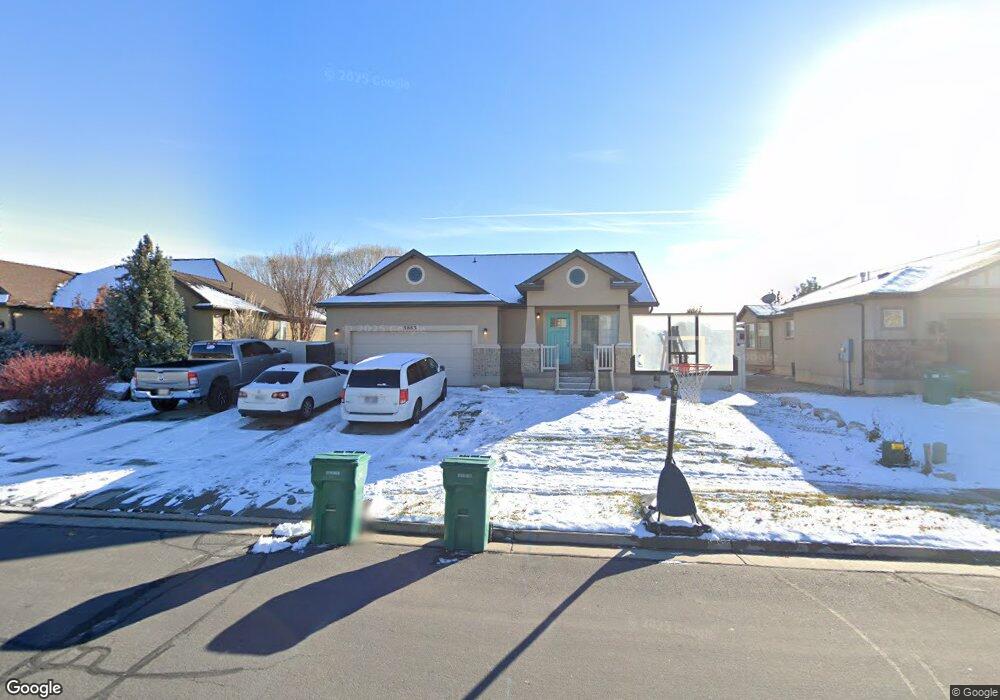
3663 W 4525 S West Haven, UT 84401
Estimated Value: $498,000 - $557,000
6
Beds
3
Baths
2,607
Sq Ft
$205/Sq Ft
Est. Value
About This Home
This home is located at 3663 W 4525 S, West Haven, UT 84401 and is currently estimated at $534,634, approximately $205 per square foot. 3663 W 4525 S is a home located in Weber County with nearby schools including West Haven School, Sand Ridge Junior High School, and Roy High School.
Ownership History
Date
Name
Owned For
Owner Type
Purchase Details
Closed on
Jul 19, 2023
Sold by
Terakee Farms Inc
Bought by
Heritage Land Development Llc
Current Estimated Value
Purchase Details
Closed on
Jun 25, 2014
Sold by
Secretary Of Hud
Bought by
Baer Russell and Bear Kelcie
Home Financials for this Owner
Home Financials are based on the most recent Mortgage that was taken out on this home.
Original Mortgage
$197,100
Interest Rate
4.17%
Mortgage Type
New Conventional
Purchase Details
Closed on
Jan 9, 2008
Sold by
Ivory Homes Ltd
Bought by
Mumford Phillip J
Home Financials for this Owner
Home Financials are based on the most recent Mortgage that was taken out on this home.
Original Mortgage
$217,780
Interest Rate
6.05%
Mortgage Type
Purchase Money Mortgage
Create a Home Valuation Report for This Property
The Home Valuation Report is an in-depth analysis detailing your home's value as well as a comparison with similar homes in the area
Home Values in the Area
Average Home Value in this Area
Purchase History
| Date | Buyer | Sale Price | Title Company |
|---|---|---|---|
| Heritage Land Development Llc | -- | Us Title | |
| Baer Russell | -- | Founders Title Co | |
| Mumford Phillip J | -- | Cottonwood Title Insurance A |
Source: Public Records
Mortgage History
| Date | Status | Borrower | Loan Amount |
|---|---|---|---|
| Previous Owner | Baer Russell | $197,100 | |
| Previous Owner | Mumford Phillip J | $217,780 |
Source: Public Records
Tax History Compared to Growth
Tax History
| Year | Tax Paid | Tax Assessment Tax Assessment Total Assessment is a certain percentage of the fair market value that is determined by local assessors to be the total taxable value of land and additions on the property. | Land | Improvement |
|---|---|---|---|---|
| 2025 | $3,103 | $504,401 | $159,965 | $344,436 |
| 2024 | $2,967 | $272,799 | $87,980 | $184,819 |
| 2023 | $2,939 | $271,150 | $87,924 | $183,226 |
| 2022 | $2,935 | $278,300 | $82,502 | $195,798 |
| 2021 | $2,456 | $389,000 | $89,905 | $299,095 |
| 2020 | $2,283 | $330,000 | $65,000 | $265,000 |
| 2019 | $2,346 | $322,000 | $54,962 | $267,038 |
| 2018 | $2,260 | $296,000 | $64,972 | $231,028 |
| 2017 | $1,935 | $243,000 | $65,018 | $177,982 |
| 2016 | $1,727 | $116,173 | $21,075 | $95,098 |
| 2015 | $1,497 | $99,081 | $21,075 | $78,006 |
| 2014 | $1,393 | $89,501 | $21,075 | $68,426 |
Source: Public Records
Map
Nearby Homes
- Villages Townhome Plan at Green Farm - Villages
- 3652 W 4625 S
- 3692 W 4625 S
- 3610 W 4475 S
- 3632 W 4650 S
- 3627 W 4650 S
- 3434 W 4525 S
- 3671 W 4700 S
- 4491 Haven Creek Rd Unit A
- 4510 Stone Creek Rd Unit F
- 4317 S 3350 W
- Poplar Plan at Highgate Cove
- Pando Plan at Highgate Cove
- 3524 W 4835 S Unit 22
- 4440 Stone Creek Rd Unit 2E
- 3523 W 4835 S Unit 28
- 4024 W 4650 S
- 3509 W 4835 S Unit 26
- 4124 S 3560 W
- 4094 W 4700 S