Estimated Value: $318,000 - $358,000
3
Beds
2
Baths
1,404
Sq Ft
$239/Sq Ft
Est. Value
About This Home
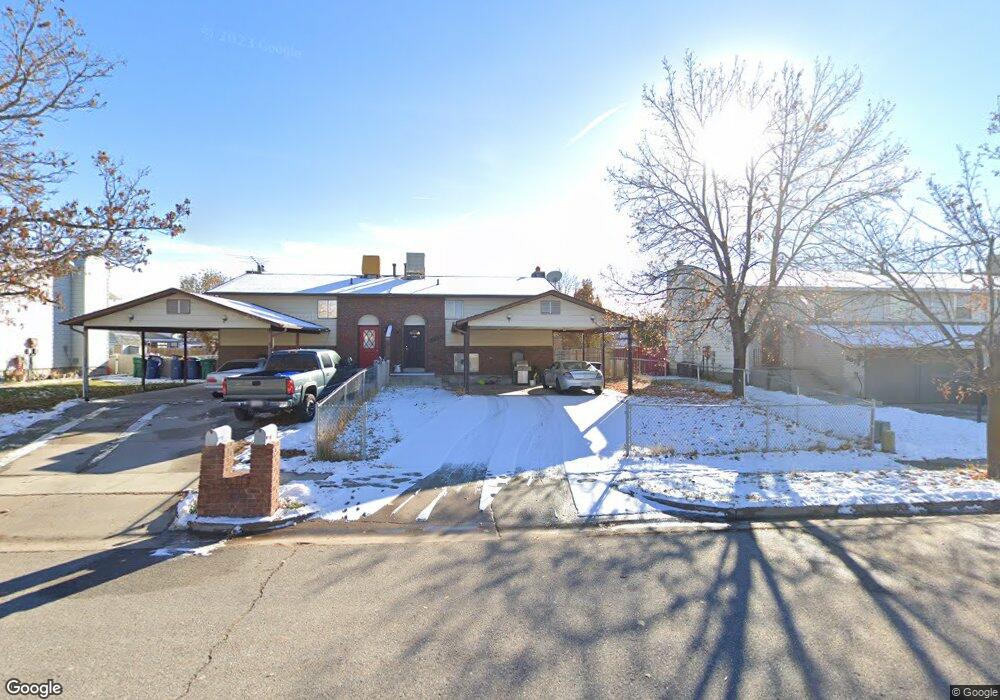
This home is located at 3663 W 4700 S, Roy, UT 84067 and is currently estimated at $334,977, approximately $238 per square foot. 3663 W 4700 S is a home located in Weber County with nearby schools including West Haven School, Sand Ridge Junior High School, and Roy High School.
Ownership History
Date
Name
Owned For
Owner Type
Purchase Details
Closed on
Feb 17, 2016
Sold by
Dominguez Justin D
Bought by
Lopez Ruben
Current Estimated Value
Home Financials for this Owner
Home Financials are based on the most recent Mortgage that was taken out on this home.
Original Mortgage
$132,554
Outstanding Balance
$105,152
Interest Rate
3.8%
Mortgage Type
FHA
Estimated Equity
$229,825
Purchase Details
Closed on
Feb 14, 2007
Sold by
Terry J Howard and Elma S Terry Family Trust
Bought by
Biggs Nicholas B
Home Financials for this Owner
Home Financials are based on the most recent Mortgage that was taken out on this home.
Original Mortgage
$93,200
Interest Rate
9.35%
Mortgage Type
Stand Alone First
Purchase Details
Closed on
Feb 28, 1996
Sold by
Terry James Howard and Terry Elma S
Bought by
Terry J Howard
Create a Home Valuation Report for This Property
The Home Valuation Report is an in-depth analysis detailing your home's value as well as a comparison with similar homes in the area
Home Values in the Area
Average Home Value in this Area
Purchase History
| Date | Buyer | Sale Price | Title Company |
|---|---|---|---|
| Lopez Ruben | -- | None Available | |
| Biggs Nicholas B | -- | Inwest Title Ogden | |
| Terry J Howard | -- | -- |
Source: Public Records
Mortgage History
| Date | Status | Borrower | Loan Amount |
|---|---|---|---|
| Open | Lopez Ruben | $132,554 | |
| Previous Owner | Biggs Nicholas B | $93,200 |
Source: Public Records
Tax History
| Year | Tax Paid | Tax Assessment Tax Assessment Total Assessment is a certain percentage of the fair market value that is determined by local assessors to be the total taxable value of land and additions on the property. | Land | Improvement |
|---|---|---|---|---|
| 2025 | $1,658 | $293,725 | $100,010 | $193,715 |
| 2024 | $1,619 | $289,000 | $100,010 | $188,990 |
| 2023 | $1,561 | $279,000 | $89,765 | $189,235 |
| 2022 | $1,625 | $296,000 | $85,001 | $210,999 |
| 2021 | $1,348 | $224,000 | $59,982 | $164,018 |
| 2020 | $1,169 | $178,000 | $59,982 | $118,018 |
| 2019 | $1,182 | $170,000 | $34,993 | $135,007 |
| 2018 | $1,170 | $159,000 | $31,047 | $127,953 |
| 2017 | $1,015 | $130,000 | $31,047 | $98,953 |
| 2016 | $923 | $63,751 | $17,032 | $46,719 |
| 2015 | $882 | $62,866 | $17,032 | $45,834 |
| 2014 | $835 | $58,830 | $17,032 | $41,798 |
Source: Public Records
Map
Nearby Homes
- 3517 W 4835 S Unit 27
- 3509 W 4835 S Unit 26
- 4813 S 3850 W
- 4950 3900 West St
- 3793 W 4475 S
- 3610 W 4475 S
- 3937 W 4650 S
- 3405 W 4525 S
- 4602 S 4000 W
- 4491 Haven Creek Rd Unit A
- 4024 W 4650 S
- 4510 Stone Creek Rd Unit F
- 4435 Cross Creek Rd Unit 29C
- 4101 W 4600 S
- 4322 S 3450 W
- 4317 S 3350 W
- 4324 S 3350 W
- 3443 W 5200 S Unit 2&3
- 3511 W 4200 S
- 4088 W 5050 S
Your Personal Tour Guide
Ask me questions while you tour the home.