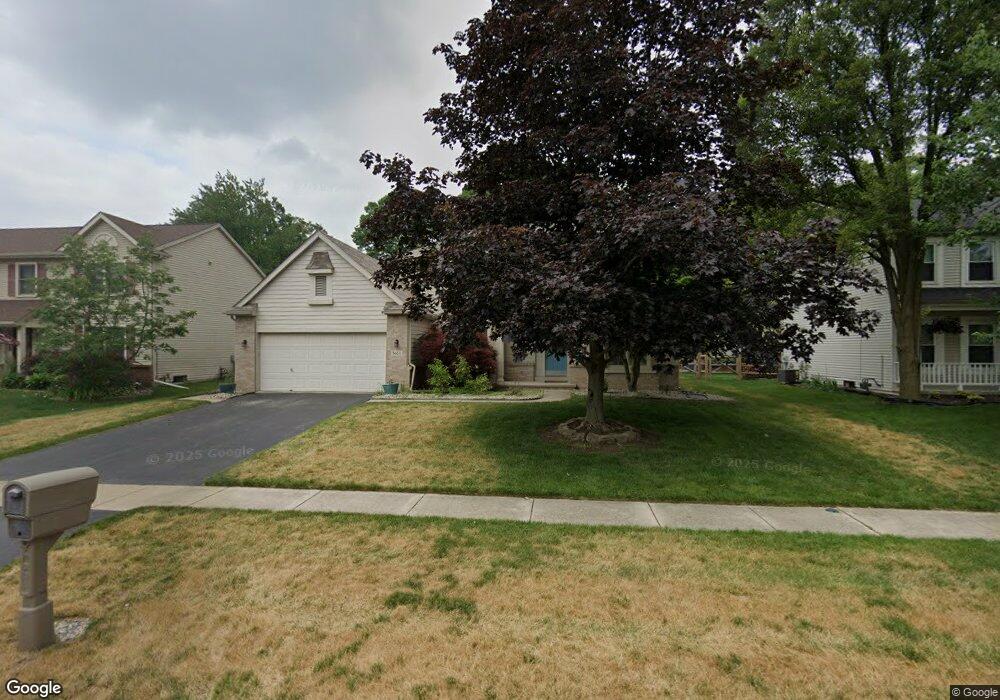
3663 Wild Pheasant Ln Sylvania, OH 43560
Estimated Value: $364,000 - $443,000
4
Beds
3
Baths
2,494
Sq Ft
$157/Sq Ft
Est. Value
About This Home
This home is located at 3663 Wild Pheasant Ln, Sylvania, OH 43560 and is currently estimated at $391,009, approximately $156 per square foot. 3663 Wild Pheasant Ln is a home located in Lucas County with nearby schools including Stranahan Elementary School, Sylvania Timberstone Junior High School, and Sylvania Southview High School.
Ownership History
Date
Name
Owned For
Owner Type
Purchase Details
Closed on
Jun 21, 2019
Sold by
Hejl Robert J and Hejl Nancy L
Bought by
Lestage Lubert M and Lestage Stacy J
Current Estimated Value
Home Financials for this Owner
Home Financials are based on the most recent Mortgage that was taken out on this home.
Original Mortgage
$181,600
Outstanding Balance
$118,840
Interest Rate
4%
Mortgage Type
New Conventional
Estimated Equity
$272,169
Purchase Details
Closed on
Aug 14, 2012
Sold by
Hejl Robert J and Hejl Nancy L
Bought by
Hejl Robert J and Hejl Nancy L
Purchase Details
Closed on
Jun 14, 1994
Sold by
Society Natl Bk Trst
Bought by
Hejl Robert J and Hejl Nancy L
Home Financials for this Owner
Home Financials are based on the most recent Mortgage that was taken out on this home.
Original Mortgage
$120,000
Interest Rate
8.45%
Mortgage Type
New Conventional
Purchase Details
Closed on
Sep 7, 1993
Create a Home Valuation Report for This Property
The Home Valuation Report is an in-depth analysis detailing your home's value as well as a comparison with similar homes in the area
Home Values in the Area
Average Home Value in this Area
Purchase History
| Date | Buyer | Sale Price | Title Company |
|---|---|---|---|
| Lestage Lubert M | $227,000 | None Available | |
| Hejl Robert J | -- | None Available | |
| Hejl Robert J | $39,500 | -- | |
| -- | -- | -- |
Source: Public Records
Mortgage History
| Date | Status | Borrower | Loan Amount |
|---|---|---|---|
| Open | Lestage Lubert M | $181,600 | |
| Previous Owner | Hejl Robert J | $120,000 |
Source: Public Records
Tax History Compared to Growth
Tax History
| Year | Tax Paid | Tax Assessment Tax Assessment Total Assessment is a certain percentage of the fair market value that is determined by local assessors to be the total taxable value of land and additions on the property. | Land | Improvement |
|---|---|---|---|---|
| 2024 | $3,851 | $119,805 | $17,360 | $102,445 |
| 2023 | $6,172 | $82,250 | $15,960 | $66,290 |
| 2022 | $6,174 | $82,250 | $15,960 | $66,290 |
| 2021 | $6,323 | $82,250 | $15,960 | $66,290 |
| 2020 | $6,892 | $79,450 | $13,720 | $65,730 |
| 2019 | $7,375 | $88,340 | $13,720 | $74,620 |
| 2018 | $6,656 | $88,340 | $13,720 | $74,620 |
| 2017 | $6,433 | $70,105 | $11,060 | $59,045 |
| 2016 | $6,310 | $200,300 | $31,600 | $168,700 |
| 2015 | $5,950 | $200,300 | $31,600 | $168,700 |
| 2014 | $5,669 | $67,410 | $10,640 | $56,770 |
| 2013 | $5,669 | $67,410 | $10,640 | $56,770 |
Source: Public Records
Map
Nearby Homes
- 3757 N Mccord Rd
- 3655 Woodspring Rd
- 3800 Harrowsfield Rd
- 6606 Blossman Rd
- 3507 Indian Oaks Ln
- 3302 Zone Ave
- 21 Shenandoah Cir
- 22 Shenandoah Cir
- 6657 Margate Blvd Unit 3
- 6537 Woodhall Dr Unit 8
- 3330 Wilford Dr
- 4022 Stonehenge Dr Unit 4022
- 6718 5th Ave Unit F
- 6537 Abbey Run Unit D5
- 6554 Abbey Run Unit 5
- 6636 Kingsbridge Dr Unit 4
- 4301 Appomattox Dr
- 6626 Kingsbridge Dr Unit 4
- 6243 Bonsels Pkwy
- 7413 Sylvania Ave
- 3703 Wild Pheasant Ln
- 3657 Wild Pheasant Ln
- 6846 Oakshade Rd
- 3709 Wild Pheasant Ln
- 6838 Oakshade Rd
- 6854 Oakshade Rd
- 3668 Wild Pheasant Ln
- 3660 Wild Pheasant Ln
- 3717 Wild Pheasant Ln
- 6858 Oakshade Rd
- 3654 Wild Pheasant Ln
- 3706 Wild Pheasant Ln
- 3641 Wild Pheasant Ln
- 3648 Wild Pheasant Ln
- 6845 Ramblehurst Rd
- 3725 Wild Pheasant Ln
- 6868 Ramblehurst Rd
- 6851 Ramblehurst Rd
- 3635 Wild Pheasant Ln
- 6862 Oakshade Rd