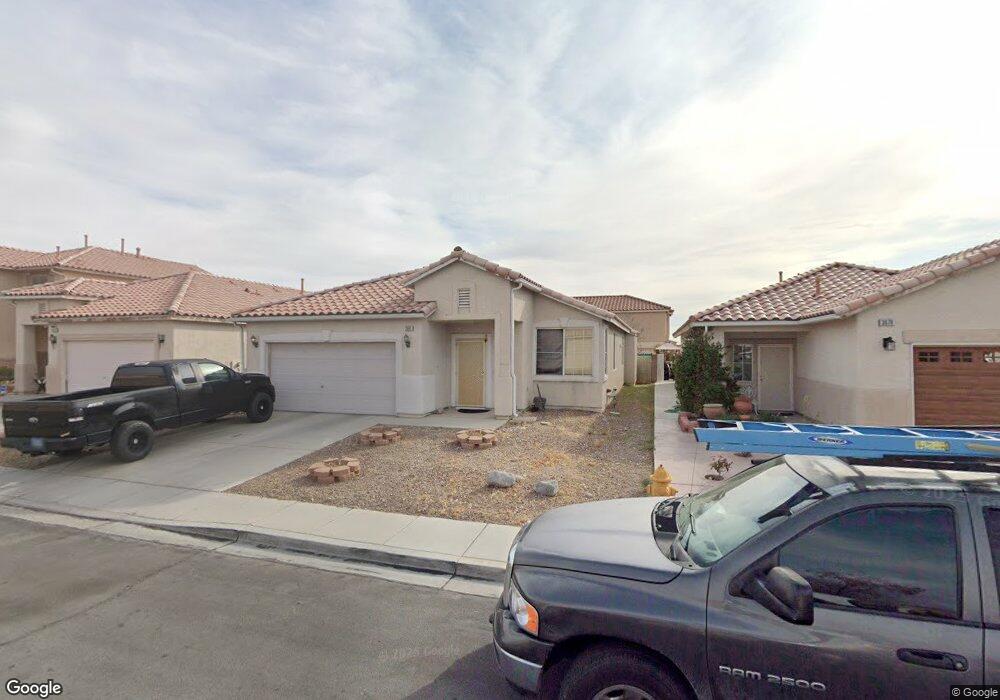
3664 Solandra St Las Vegas, NV 89147
Rancho Viejo NeighborhoodEstimated Value: $442,000 - $478,000
3
Beds
2
Baths
1,602
Sq Ft
$288/Sq Ft
Est. Value
About This Home
This home is located at 3664 Solandra St, Las Vegas, NV 89147 and is currently estimated at $460,872, approximately $287 per square foot. 3664 Solandra St is a home located in Clark County with nearby schools including Keith C. & Karen W. Hayes Elementary School, Victoria Fertitta Middle School, and Spring Valley High School.
Ownership History
Date
Name
Owned For
Owner Type
Purchase Details
Closed on
Jan 13, 2009
Sold by
Miller Joseph E and Haley Cherry N
Bought by
Haley Cherry N
Current Estimated Value
Home Financials for this Owner
Home Financials are based on the most recent Mortgage that was taken out on this home.
Original Mortgage
$231,837
Outstanding Balance
$149,796
Interest Rate
5.6%
Mortgage Type
FHA
Estimated Equity
$311,076
Purchase Details
Closed on
Sep 26, 2002
Sold by
Haley Cherry N
Bought by
Miller Joseph E and Haley Cherry N
Home Financials for this Owner
Home Financials are based on the most recent Mortgage that was taken out on this home.
Original Mortgage
$131,000
Interest Rate
6.22%
Purchase Details
Closed on
Nov 29, 1999
Sold by
Kaufman & Broad Of Nevada Inc
Bought by
Haley Cherry N and Miller Joseph E
Home Financials for this Owner
Home Financials are based on the most recent Mortgage that was taken out on this home.
Original Mortgage
$134,049
Interest Rate
7.84%
Mortgage Type
FHA
Create a Home Valuation Report for This Property
The Home Valuation Report is an in-depth analysis detailing your home's value as well as a comparison with similar homes in the area
Home Values in the Area
Average Home Value in this Area
Purchase History
| Date | Buyer | Sale Price | Title Company |
|---|---|---|---|
| Haley Cherry N | -- | First American Title Paseo V | |
| Miller Joseph E | $65,500 | Fidelity National Title | |
| Haley Cherry N | $137,240 | First American Title Co |
Source: Public Records
Mortgage History
| Date | Status | Borrower | Loan Amount |
|---|---|---|---|
| Open | Haley Cherry N | $231,837 | |
| Closed | Miller Joseph E | $131,000 | |
| Closed | Haley Cherry N | $134,049 |
Source: Public Records
Tax History Compared to Growth
Tax History
| Year | Tax Paid | Tax Assessment Tax Assessment Total Assessment is a certain percentage of the fair market value that is determined by local assessors to be the total taxable value of land and additions on the property. | Land | Improvement |
|---|---|---|---|---|
| 2025 | $2,326 | $104,531 | $41,300 | $63,231 |
| 2024 | $2,155 | $104,531 | $41,300 | $63,231 |
| 2023 | $1,434 | $96,452 | $36,400 | $60,052 |
| 2022 | $1,995 | $84,968 | $30,100 | $54,868 |
| 2021 | $1,848 | $78,066 | $25,900 | $52,166 |
| 2020 | $1,713 | $76,321 | $24,500 | $51,821 |
| 2019 | $1,605 | $73,742 | $22,750 | $50,992 |
| 2018 | $1,532 | $67,297 | $18,200 | $49,097 |
| 2017 | $1,961 | $66,874 | $17,150 | $49,724 |
| 2016 | $1,434 | $61,303 | $11,550 | $49,753 |
| 2015 | $1,431 | $50,632 | $10,850 | $39,782 |
| 2014 | $1,386 | $45,864 | $9,800 | $36,064 |
Source: Public Records
Map
Nearby Homes
- 9475 Sand Villa Ct
- 9545 Canyonland Ct
- 9587 Windborne Ave
- 9485 Camino Capistrano Ln Unit 1
- 9500 Catalina Cove Cir
- 9605 Rainfall Ave
- 3580 Teton Hills St
- 3757 Horseshoe Mesa St
- 3559 S Dapple Gray Rd
- 9506 Teton Diablo Ave
- 9615 Sedona Hills Ct
- 9376 Peace Pipe Ct
- 3891 Lilac Haze St
- 9591 Borgata Bay Blvd
- 9718 Camino Capistrano Ln
- 9334 Peace Pipe Ct
- 3930 Starfield Ln Unit O58
- 9514 Teton Vista Ave
- 9750 W Cherokee Ave Unit 1
- 9758 Camino Capistrano Ln
- 3670 Solandra St
- 3658 Solandra St
- 9498 Jumping Frog Ct
- 3676 Solandra St
- 3652 Solandra St
- 9492 Jumping Frog Ct Unit Lot 5
- 3682 Solandra St
- 9530 Sunshade Ct
- 9497 Samuel Clemens Ct
- 9486 Jumping Frog Ct Unit Lot 4
- 9491 Samuel Clemens Ct
- 9531 Sun Drop Ct
- 3640 Solandra St
- 3688 Solandra St
- 9536 Sunshade Ct
- 9493 Jumping Frog Ct Unit Lot 2
- 9485 Samuel Clemens Ct Unit Lot 9
- 9485 Samuel Clemens Ct
- 9531 Sunshade Ct