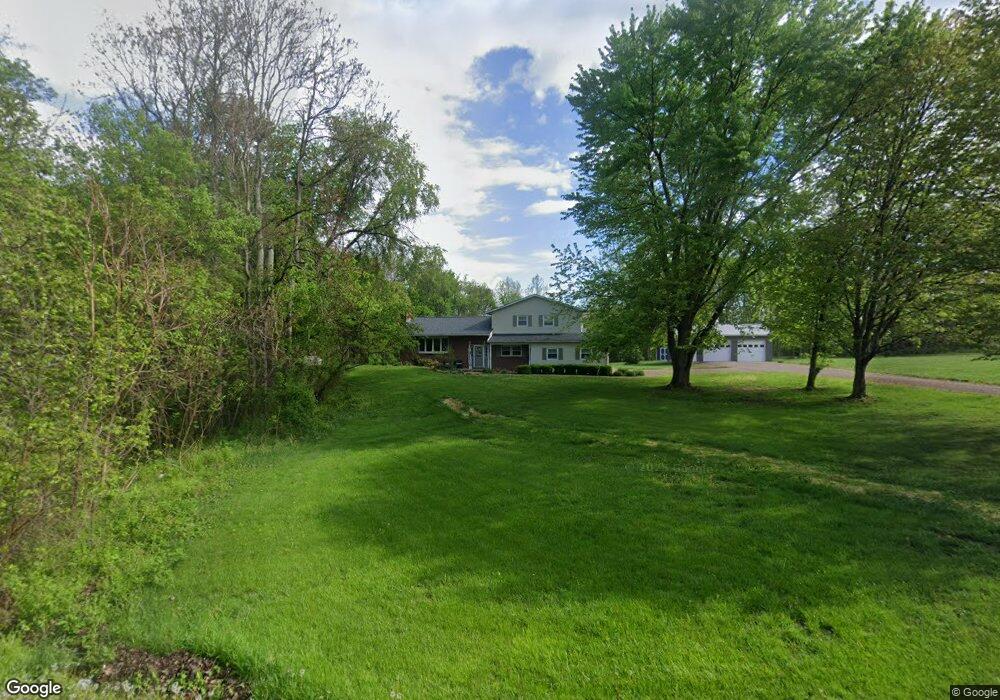
3665 S Pleasant Grove Rd Zanesville, OH 43701
Estimated Value: $186,000 - $373,000
4
Beds
3
Baths
2,100
Sq Ft
$151/Sq Ft
Est. Value
About This Home
This home is located at 3665 S Pleasant Grove Rd, Zanesville, OH 43701 and is currently estimated at $316,664, approximately $150 per square foot. 3665 S Pleasant Grove Rd is a home located in Muskingum County with nearby schools including Philo High School, Bishop Fenwick School, and Zanesville Christian School.
Ownership History
Date
Name
Owned For
Owner Type
Purchase Details
Closed on
Dec 13, 2018
Sold by
Braglin Brian L and Braglin Deborah L
Bought by
Sprankle Cody A and Sprankle Ashley N
Current Estimated Value
Home Financials for this Owner
Home Financials are based on the most recent Mortgage that was taken out on this home.
Original Mortgage
$172,000
Outstanding Balance
$151,536
Interest Rate
4.8%
Mortgage Type
New Conventional
Estimated Equity
$165,128
Purchase Details
Closed on
Apr 2, 1998
Sold by
Kasper Sharon M
Bought by
Braglin Brian L and Braglin Deborah L
Home Financials for this Owner
Home Financials are based on the most recent Mortgage that was taken out on this home.
Original Mortgage
$76,000
Interest Rate
7.09%
Mortgage Type
New Conventional
Purchase Details
Closed on
Feb 26, 1992
Bought by
Kasper Sharon M
Create a Home Valuation Report for This Property
The Home Valuation Report is an in-depth analysis detailing your home's value as well as a comparison with similar homes in the area
Home Values in the Area
Average Home Value in this Area
Purchase History
| Date | Buyer | Sale Price | Title Company |
|---|---|---|---|
| Sprankle Cody A | $215,000 | None Available | |
| Braglin Brian L | $80,000 | -- | |
| Kasper Sharon M | $66,500 | -- |
Source: Public Records
Mortgage History
| Date | Status | Borrower | Loan Amount |
|---|---|---|---|
| Open | Sprankle Cody A | $172,000 | |
| Previous Owner | Braglin Brian L | $76,000 |
Source: Public Records
Tax History Compared to Growth
Tax History
| Year | Tax Paid | Tax Assessment Tax Assessment Total Assessment is a certain percentage of the fair market value that is determined by local assessors to be the total taxable value of land and additions on the property. | Land | Improvement |
|---|---|---|---|---|
| 2024 | $2,715 | $84,175 | $9,905 | $74,270 |
| 2023 | $1,942 | $57,120 | $7,840 | $49,280 |
| 2022 | $1,862 | $57,120 | $7,840 | $49,280 |
| 2021 | $1,694 | $52,885 | $7,840 | $45,045 |
| 2020 | $1,620 | $49,525 | $7,105 | $42,420 |
| 2019 | $1,616 | $49,525 | $7,105 | $42,420 |
| 2018 | $1,653 | $49,525 | $7,105 | $42,420 |
| 2017 | $1,224 | $34,265 | $7,105 | $27,160 |
| 2016 | $1,176 | $34,270 | $7,110 | $27,160 |
| 2015 | $1,209 | $34,270 | $7,110 | $27,160 |
| 2013 | $1,300 | $34,270 | $7,110 | $27,160 |
Source: Public Records
Map
Nearby Homes
- 240 Mockingbird Hill
- 2850 Watson Way
- 2465 Clay Pike
- 2425 S Pleasant Grove Rd
- 2870 Cody Dr
- 2755 N Lawndale Place
- 365 Walters Way
- 360 Walters Way
- 440 Stardust Cir
- 496 Pleasant Grove Rd
- 0 East Pike Unit 5163133
- 4460 East Pike
- 2383 Chandlersville Rd
- 1605 Jackson Rd
- 2397 Adamsville Rd
- 2230 Adamsville Rd
- 5180 Pine Valley Dr
- 130 Airport Rd
- 1636 Sharon Ave
- 2835 Adamsville Rd
- 3685 S Pleasant Grove Rd
- 3733 Clay Pike
- 3635 Clay Pike
- 3700 Clay Pike
- 3721 Clay Pike
- 3705 Clay Pike
- 3660 Clay Pike
- 3650 S Pleasant Grove Rd
- 3745 Clay Pike
- 3716 Clay Pike
- 3600 Clay Pike
- 3785 Clay Pike
- 3585 Clay Pike
- 3815 Clay Pike
- 3835 Clay Pike
- 3855 Clay Pike
- 3505 Clay Pike
- 975 Locust Lake Cir
- 985 Locust Lake Cir
- 995 Locust Lake Cir