Estimated Value: $525,000 - $701,000
4
Beds
3
Baths
1,874
Sq Ft
$327/Sq Ft
Est. Value
About This Home
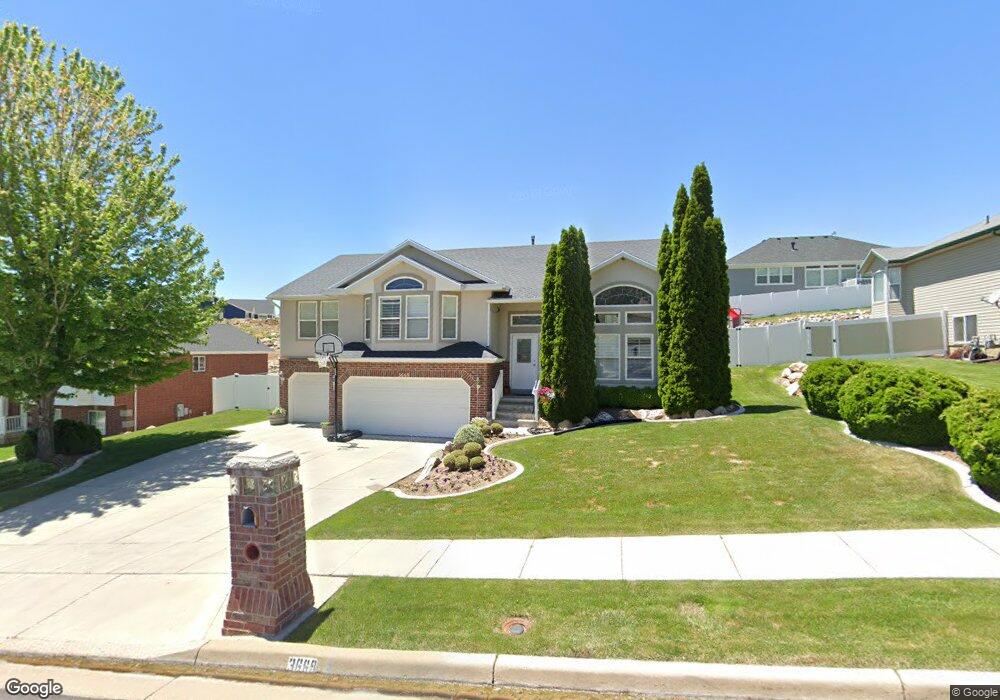
This home is located at 3669 N 225 E, Ogden, UT 84414 and is currently estimated at $613,280, approximately $327 per square foot. 3669 N 225 E is a home located in Weber County with nearby schools including Bates School, North Ogden Junior High School, and Weber High School.
Ownership History
Date
Name
Owned For
Owner Type
Purchase Details
Closed on
Nov 19, 2009
Sold by
Pauling Chad M and Pauling Amy A
Bought by
Pauling Amy and Pauling Chad
Current Estimated Value
Home Financials for this Owner
Home Financials are based on the most recent Mortgage that was taken out on this home.
Original Mortgage
$200,000
Outstanding Balance
$129,452
Interest Rate
4.83%
Mortgage Type
New Conventional
Estimated Equity
$483,828
Purchase Details
Closed on
Oct 26, 1999
Sold by
Koz Construction
Bought by
Pauling Chad M and Pauling Amy A
Purchase Details
Closed on
Feb 16, 1999
Sold by
Aland James
Bought by
Koz Construction
Purchase Details
Closed on
Feb 4, 1999
Sold by
Sdf Properties Lc
Bought by
Randy Marriott Construction
Create a Home Valuation Report for This Property
The Home Valuation Report is an in-depth analysis detailing your home's value as well as a comparison with similar homes in the area
Home Values in the Area
Average Home Value in this Area
Purchase History
| Date | Buyer | Sale Price | Title Company |
|---|---|---|---|
| Pauling Amy | -- | First American Fashion Point | |
| Pauling Chad M | -- | Mountain View Title | |
| Koz Construction | -- | Mountain View Title | |
| Koz Construction | -- | Mountain View Title | |
| Aland James | -- | Mountain View Title | |
| Randy Marriott Construction | -- | Mountain View Title | |
| Koz Construction | -- | Mountain View Title |
Source: Public Records
Mortgage History
| Date | Status | Borrower | Loan Amount |
|---|---|---|---|
| Open | Pauling Amy | $200,000 |
Source: Public Records
Tax History
| Year | Tax Paid | Tax Assessment Tax Assessment Total Assessment is a certain percentage of the fair market value that is determined by local assessors to be the total taxable value of land and additions on the property. | Land | Improvement |
|---|---|---|---|---|
| 2025 | $3,920 | $572,141 | $185,617 | $386,524 |
| 2024 | $3,932 | $324,499 | $102,089 | $222,410 |
| 2023 | $3,789 | $317,900 | $102,277 | $215,623 |
| 2022 | $3,757 | $325,050 | $102,277 | $222,773 |
| 2021 | $3,154 | $463,000 | $96,502 | $366,498 |
| 2020 | $2,823 | $384,000 | $77,529 | $306,471 |
| 2019 | $2,741 | $358,000 | $72,578 | $285,422 |
| 2018 | $2,586 | $322,000 | $72,578 | $249,422 |
| 2017 | $2,508 | $294,000 | $72,578 | $221,422 |
| 2016 | $2,526 | $160,583 | $40,065 | $120,518 |
| 2015 | $2,298 | $143,031 | $34,576 | $108,455 |
| 2014 | $2,117 | $127,835 | $34,576 | $93,259 |
Source: Public Records
Map
Nearby Homes
Your Personal Tour Guide
Ask me questions while you tour the home.