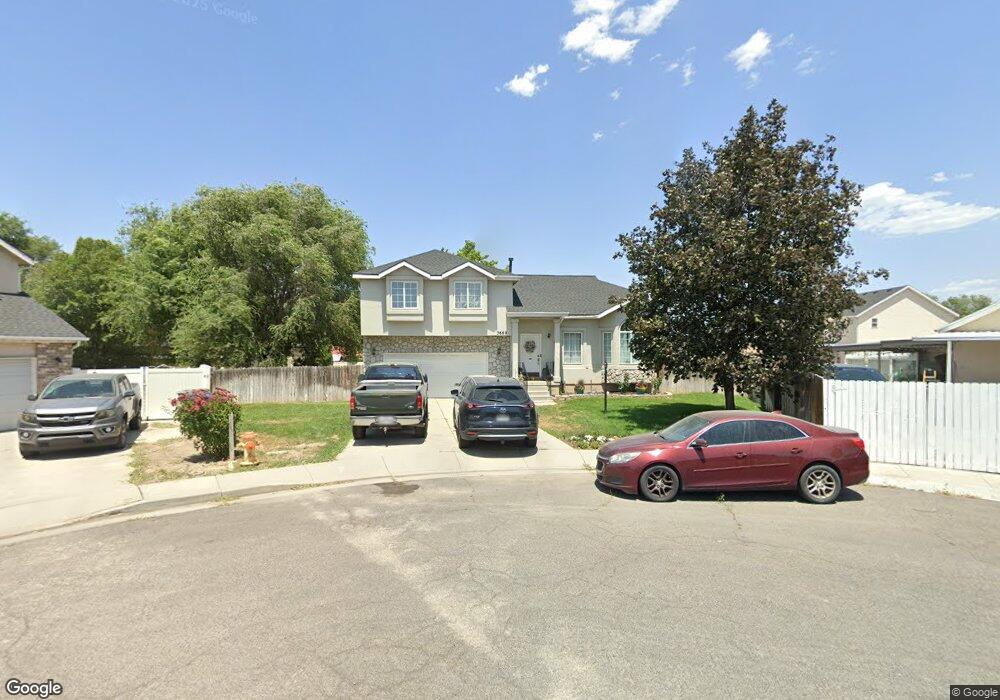
3669 Pumpkin Patch Cir Salt Lake City, UT 84120
Granger NeighborhoodEstimated Value: $488,000 - $547,625
3
Beds
2
Baths
1,523
Sq Ft
$341/Sq Ft
Est. Value
About This Home
This home is located at 3669 Pumpkin Patch Cir, Salt Lake City, UT 84120 and is currently estimated at $519,906, approximately $341 per square foot. 3669 Pumpkin Patch Cir is a home located in Salt Lake County with nearby schools including Pioneer Elementary School, Valley Junior High School, and Granger High School.
Ownership History
Date
Name
Owned For
Owner Type
Purchase Details
Closed on
Dec 21, 2009
Sold by
Chapman Thomas and Dozier Tammy L
Bought by
Gibbs Jared M
Current Estimated Value
Home Financials for this Owner
Home Financials are based on the most recent Mortgage that was taken out on this home.
Original Mortgage
$186,558
Outstanding Balance
$121,496
Interest Rate
4.87%
Mortgage Type
FHA
Estimated Equity
$398,410
Purchase Details
Closed on
Aug 7, 1998
Sold by
Smith Glen E and Smith Kimberly A
Bought by
Chapman Thomas and Dozier Tammy L
Home Financials for this Owner
Home Financials are based on the most recent Mortgage that was taken out on this home.
Original Mortgage
$143,450
Interest Rate
6.93%
Mortgage Type
Purchase Money Mortgage
Purchase Details
Closed on
May 2, 1995
Sold by
Bridlevale Ltd
Bought by
Smith Glen E and Smith Kimberly A
Home Financials for this Owner
Home Financials are based on the most recent Mortgage that was taken out on this home.
Original Mortgage
$122,545
Interest Rate
8.46%
Mortgage Type
Purchase Money Mortgage
Create a Home Valuation Report for This Property
The Home Valuation Report is an in-depth analysis detailing your home's value as well as a comparison with similar homes in the area
Home Values in the Area
Average Home Value in this Area
Purchase History
| Date | Buyer | Sale Price | Title Company |
|---|---|---|---|
| Gibbs Jared M | -- | Equity Title Insurance Agenc | |
| Chapman Thomas | -- | -- | |
| Smith Glen E | -- | -- |
Source: Public Records
Mortgage History
| Date | Status | Borrower | Loan Amount |
|---|---|---|---|
| Open | Gibbs Jared M | $186,558 | |
| Previous Owner | Chapman Thomas | $143,450 | |
| Previous Owner | Smith Glen E | $122,545 |
Source: Public Records
Tax History Compared to Growth
Tax History
| Year | Tax Paid | Tax Assessment Tax Assessment Total Assessment is a certain percentage of the fair market value that is determined by local assessors to be the total taxable value of land and additions on the property. | Land | Improvement |
|---|---|---|---|---|
| 2025 | $3,605 | $507,300 | $154,700 | $352,600 |
| 2024 | $3,605 | $503,200 | $150,500 | $352,700 |
| 2023 | $3,605 | $462,600 | $144,800 | $317,800 |
| 2022 | $3,496 | $480,900 | $141,900 | $339,000 |
| 2021 | $2,855 | $377,400 | $109,100 | $268,300 |
| 2020 | $2,655 | $331,200 | $102,100 | $229,100 |
| 2019 | $2,607 | $313,700 | $96,300 | $217,400 |
| 2018 | $2,507 | $290,700 | $96,300 | $194,400 |
| 2017 | $2,385 | $281,300 | $96,300 | $185,000 |
| 2016 | $2,107 | $249,000 | $96,300 | $152,700 |
| 2015 | $2,073 | $233,200 | $106,600 | $126,600 |
| 2014 | $2,034 | $224,200 | $103,500 | $120,700 |
Source: Public Records
Map
Nearby Homes
- 4050 W Mann Way
- 3916 S Hawkeye St
- 3741 W 3830 S
- 3907 W Rockwood Way Unit B
- 3533 W 3650 S Unit 3535
- 3818 W Edgewater Cir
- 4209 W 3860 S
- 4217 W 3450 S Unit 218
- 4232 W 3475 S Unit 211
- 3780 S 3520 W
- 3486 S Westcrest Rd Unit 2
- 4230 W 3375 S Unit 240
- 3754 Brookside Dr Unit 1
- 4230 W 3425 S Unit 226
- 3664 W 3965 S
- 4123 W 3980 S
- 3333 S Westcrest Rd Unit 249
- 4358 W 3870 S
- 3761 S Oxford Way
- 4308 W Volta Ave
- 3669 S Pumpkin Patch Cir
- 3674 Pumpkin Patch Cir
- 3652 Hawk Nest Cir
- 3674 S Pumpkin Patch Cir
- 3924 Sugar Beet Dr
- 3675 S 4000 W
- 3924 W Sugar Beet Dr
- 3914 Sugar Beet Dr
- 3650 S Hawk Nest Cir
- 3654 Hawk Nest Cir
- 3936 Sugar Beet Dr
- 3650 Hawk Nest Cir
- 3914 W Sugar Beet Dr
- 3952 Sugar Beet Dr
- 3952 W Sugar Beet Dr
- 3966 Sugar Beet Dr
- 3648 Hawk Nest Cir
- 3966 W Sugar Beet Dr
- 3653 S 4000 W
- 3923 Sugar Beet Dr