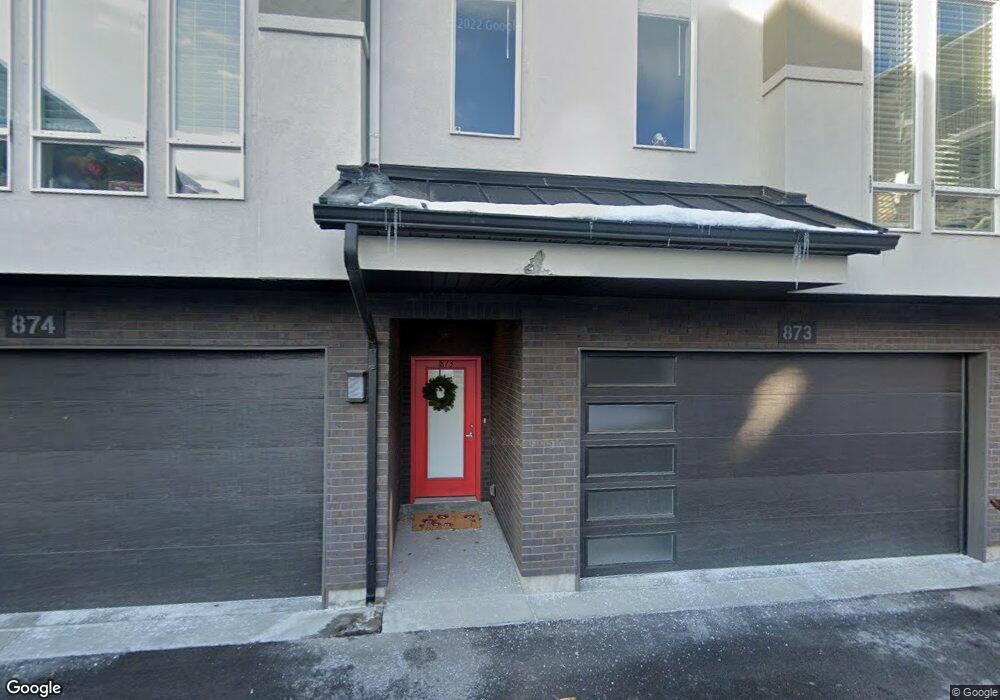
3669 S 860 E Unit 26 Salt Lake City, UT 84106
Estimated Value: $315,035 - $354,000
2
Beds
2
Baths
1,288
Sq Ft
$258/Sq Ft
Est. Value
About This Home
This home is located at 3669 S 860 E Unit 26, Salt Lake City, UT 84106 and is currently estimated at $332,259, approximately $257 per square foot. 3669 S 860 E Unit 26 is a home located in Salt Lake County with nearby schools including Millcreek Elementary School, Lincoln Elementary, and Evergreen Junior High School.
Ownership History
Date
Name
Owned For
Owner Type
Purchase Details
Closed on
Jan 12, 2024
Sold by
Matheson Family Trust
Bought by
Girouard James and Girouard Shirley
Current Estimated Value
Home Financials for this Owner
Home Financials are based on the most recent Mortgage that was taken out on this home.
Original Mortgage
$165,000
Outstanding Balance
$162,257
Interest Rate
7.22%
Mortgage Type
New Conventional
Estimated Equity
$170,002
Purchase Details
Closed on
Sep 28, 2004
Sold by
Strani Kathryn P
Bought by
Matheson Family Trust and Matheson Jerry M
Purchase Details
Closed on
May 21, 1999
Sold by
Davis Robert K
Bought by
Strani Alfredo and Strani Kathryn P
Purchase Details
Closed on
Sep 18, 1998
Sold by
Ford George W and Ford Grace B
Bought by
Davis Robert K
Home Financials for this Owner
Home Financials are based on the most recent Mortgage that was taken out on this home.
Original Mortgage
$83,000
Interest Rate
6.89%
Create a Home Valuation Report for This Property
The Home Valuation Report is an in-depth analysis detailing your home's value as well as a comparison with similar homes in the area
Home Values in the Area
Average Home Value in this Area
Purchase History
| Date | Buyer | Sale Price | Title Company |
|---|---|---|---|
| Girouard James | -- | Meridian Title Company | |
| Matheson Family Trust | -- | Superior Title | |
| Strani Alfredo | -- | Superior Title Company | |
| Davis Robert K | -- | Superior Title Company |
Source: Public Records
Mortgage History
| Date | Status | Borrower | Loan Amount |
|---|---|---|---|
| Open | Girouard James | $165,000 | |
| Previous Owner | Davis Robert K | $83,000 |
Source: Public Records
Tax History Compared to Growth
Tax History
| Year | Tax Paid | Tax Assessment Tax Assessment Total Assessment is a certain percentage of the fair market value that is determined by local assessors to be the total taxable value of land and additions on the property. | Land | Improvement |
|---|---|---|---|---|
| 2025 | $1,999 | $325,600 | $97,700 | $227,900 |
| 2024 | $1,999 | $320,100 | $96,000 | $224,100 |
| 2023 | $1,689 | $261,100 | $78,300 | $182,800 |
| 2022 | $1,667 | $259,000 | $77,700 | $181,300 |
| 2021 | $1,471 | $198,100 | $59,400 | $138,700 |
| 2020 | $1,321 | $168,000 | $50,400 | $117,600 |
| 2019 | $1,284 | $159,500 | $47,800 | $111,700 |
| 2018 | $1,216 | $145,400 | $43,600 | $101,800 |
| 2017 | $1,022 | $128,000 | $38,400 | $89,600 |
| 2016 | $970 | $122,700 | $36,800 | $85,900 |
| 2015 | $986 | $116,800 | $35,000 | $81,800 |
| 2014 | -- | $115,600 | $34,700 | $80,900 |
Source: Public Records
Map
Nearby Homes
- 3674 S 860 E Unit 46
- 3674 S 860 E Unit 45
- 3610 S 805 St E Unit 233
- 815 E Whitemaple Way
- 833 E Whitemaple Way
- 787 E Redmaple Cir
- 841 Whitemaple Way Unit 843
- 734 E 3690 S Unit 31
- 3578 S 805 E Unit 237
- 3580 S 805 St E Unit 229
- 3580 S 805 St E Unit 231
- 733 E 3710 S Unit 26
- 721 E 3720 S Unit 5
- 3605 S 900 E
- 3532 S 900 E
- 883 E Arnecia Ct Unit 31
- 728 E Empire Ave
- 3594 S 700 E
- 4194 S Carolyn St
- 3938 S 805 E Unit A
- 3669 S 860 E Unit 31
- 3669 S 860 E Unit 28
- 3669 S 860 E Unit 27
- 3669 S 860 E Unit 30
- 3669 S 860 E Unit 32
- 3669 S 860 E
- 3674 S 860 E Unit 47
- 3674 S 860 E Unit 48
- 3664 S 860 E Unit 49
- 3664 S 860 E Unit 51
- 3664 S 860 E Unit 52
- 3673 S 805 E Unit 2
- 3673 S 805 E Unit 1
- 3673 S 805 E Unit 4
- 3673 S 805 E Unit 3
- 3663 S 805 E Unit 8
- 3663 S 805 E Unit 6
- 3663 S 805 E Unit 7
- 3663 S 805 E Unit 5
- 3654 S 860 E Unit 56