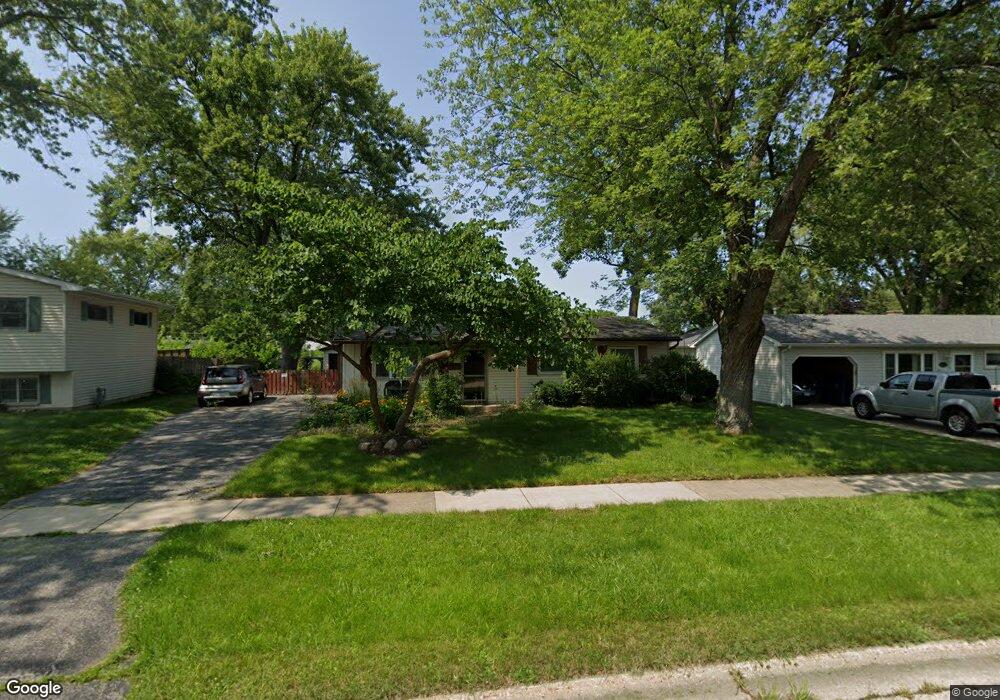
36692 N Traer Terrace Gurnee, IL 60031
Estimated Value: $256,000 - $303,000
--
Bed
2
Baths
1,025
Sq Ft
$267/Sq Ft
Est. Value
About This Home
This home is located at 36692 N Traer Terrace, Gurnee, IL 60031 and is currently estimated at $273,960, approximately $267 per square foot. 36692 N Traer Terrace is a home located in Lake County with nearby schools including Woodland Primary School, Woodland Intermediate School, and Woodland Elementary School.
Ownership History
Date
Name
Owned For
Owner Type
Purchase Details
Closed on
Sep 16, 2021
Sold by
Moffett Lance
Bought by
Moffett Benjamin
Current Estimated Value
Home Financials for this Owner
Home Financials are based on the most recent Mortgage that was taken out on this home.
Original Mortgage
$182,750
Interest Rate
2.88%
Mortgage Type
New Conventional
Purchase Details
Closed on
Feb 23, 2016
Sold by
Moffett Amy
Bought by
Moffett Lance
Purchase Details
Closed on
Jul 17, 2001
Sold by
Mccandless Danny R and Mccandless Taryn
Bought by
Moffett Lance and Moffett Amy
Home Financials for this Owner
Home Financials are based on the most recent Mortgage that was taken out on this home.
Original Mortgage
$149,150
Interest Rate
7.15%
Purchase Details
Closed on
Feb 5, 1997
Sold by
Barnich James M and Barnich Linda R
Bought by
Mccandless Danny R
Home Financials for this Owner
Home Financials are based on the most recent Mortgage that was taken out on this home.
Original Mortgage
$100,300
Interest Rate
6.5%
Create a Home Valuation Report for This Property
The Home Valuation Report is an in-depth analysis detailing your home's value as well as a comparison with similar homes in the area
Home Values in the Area
Average Home Value in this Area
Purchase History
| Date | Buyer | Sale Price | Title Company |
|---|---|---|---|
| Moffett Benjamin | $215,000 | Attorney | |
| Moffett Lance | -- | Attorney | |
| Moffett Lance | $158,000 | -- | |
| Mccandless Danny R | $118,000 | First American Title |
Source: Public Records
Mortgage History
| Date | Status | Borrower | Loan Amount |
|---|---|---|---|
| Previous Owner | Moffett Benjamin | $182,750 | |
| Previous Owner | Moffett Lance | $149,150 | |
| Previous Owner | Mccandless Danny R | $100,300 |
Source: Public Records
Tax History Compared to Growth
Tax History
| Year | Tax Paid | Tax Assessment Tax Assessment Total Assessment is a certain percentage of the fair market value that is determined by local assessors to be the total taxable value of land and additions on the property. | Land | Improvement |
|---|---|---|---|---|
| 2024 | $5,830 | $72,090 | $11,961 | $60,129 |
| 2023 | $5,714 | $64,981 | $10,782 | $54,199 |
| 2022 | $5,714 | $59,071 | $11,215 | $47,856 |
| 2021 | $4,974 | $54,520 | $10,351 | $44,169 |
| 2020 | $4,787 | $53,180 | $10,097 | $43,083 |
| 2019 | $4,690 | $51,636 | $9,804 | $41,832 |
| 2018 | $3,856 | $44,428 | $13,428 | $31,000 |
| 2017 | $3,854 | $43,155 | $13,043 | $30,112 |
| 2016 | $3,817 | $41,233 | $12,462 | $28,771 |
| 2015 | $3,679 | $39,106 | $11,819 | $27,287 |
| 2014 | $3,229 | $36,000 | $12,375 | $23,625 |
| 2012 | $3,487 | $36,276 | $12,470 | $23,806 |
Source: Public Records
Map
Nearby Homes
- 36712 N Traer Terrace
- 18595 W Judy Dr
- 18758 W Highfield Dr
- 36688 N Yew Tree Dr
- 18325 W Lakeview Terrace
- 18229 W Banbury Dr
- 36873 N Deer Trail Dr
- 18705 W Ash Dr
- 17925 W Stearns School Rd
- 36225 N Us Highway 45
- 17876 W Braewick Rd
- 17781 W Elsbury St
- 17820 W Braewick Rd
- 17775 W Braewick Rd
- 36259 N Field View Dr
- Abbeyville Plan at Briargate
- Ascend with Basement Plan at Briargate
- Abbeyville with Basement Plan at Briargate
- Martin Ray with Basement Plan at Briargate
- Ascend Plan at Briargate
- 36682 N Traer Terrace
- 36702 N Traer Terrace
- 36672 N Traer Terrace
- 37221 N Grandwood Dr
- 37207 N Grandwood Dr
- 37235 N Grandwood Dr
- 37193 N Grandwood Dr
- 36724 N Traer Terrace
- 37249 N Grandwood Dr
- 37179 N Grandwood Dr
- 36695 N Traer Terrace
- 36658 N Traer Terrace
- 36681 N Traer Terrace
- 36709 N Traer Terrace
- 36721 N Traer Terrace
- 37263 N Grandwood Dr Unit 4
- 37165 N Grandwood Dr
- 36736 N Traer Terrace
- 36648 N Traer Terrace
- 36733 N Traer Terrace