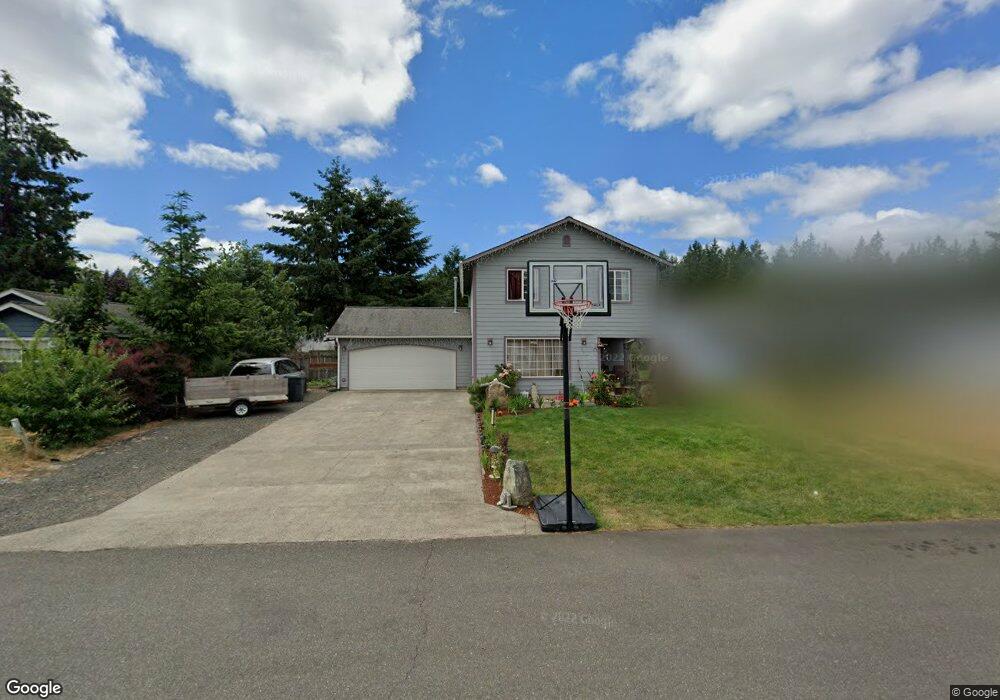
367 E Springfield Loop Shelton, WA 98584
Estimated Value: $327,000 - $373,000
4
Beds
2
Baths
1,328
Sq Ft
$267/Sq Ft
Est. Value
About This Home
This home is located at 367 E Springfield Loop, Shelton, WA 98584 and is currently estimated at $354,305, approximately $266 per square foot. 367 E Springfield Loop is a home located in Mason County with nearby schools including Mountain View Elementary School, Oakland Bay Junior High School, and Olympic Middle School.
Ownership History
Date
Name
Owned For
Owner Type
Purchase Details
Closed on
Dec 6, 2017
Sold by
Ortiz Bernardo Hernandez
Bought by
Fregoso Alonso Flores and Sereano Lino Fleres
Current Estimated Value
Purchase Details
Closed on
Nov 24, 2017
Sold by
Ortiz Bernardo
Bought by
Fregoso Alonso and Serrano Lino F
Purchase Details
Closed on
Dec 12, 2014
Sold by
Federal Home Loan Mortgage Corporation
Bought by
Ortiz Bernardo Hernandez
Purchase Details
Closed on
Mar 17, 2014
Sold by
Saeger Jerry L and Saeger Trina M
Bought by
Federal Home Loan Mortgage Corporation
Purchase Details
Closed on
Sep 8, 2006
Sold by
Saeger Jerry
Bought by
Saeger Jerry L and Saeger Trina M
Home Financials for this Owner
Home Financials are based on the most recent Mortgage that was taken out on this home.
Original Mortgage
$169,600
Interest Rate
6.56%
Mortgage Type
New Conventional
Create a Home Valuation Report for This Property
The Home Valuation Report is an in-depth analysis detailing your home's value as well as a comparison with similar homes in the area
Purchase History
| Date | Buyer | Sale Price | Title Company |
|---|---|---|---|
| Fregoso Alonso Flores | -- | None Available | |
| Fregoso Alonso | -- | None Listed On Document | |
| Ortiz Bernardo Hernandez | -- | First American Title | |
| Federal Home Loan Mortgage Corporation | $124,962 | 1St Am | |
| Saeger Jerry L | -- | Mason County Title Ins Co |
Source: Public Records
Mortgage History
| Date | Status | Borrower | Loan Amount |
|---|---|---|---|
| Previous Owner | Saeger Jerry L | $169,600 |
Source: Public Records
Tax History
| Year | Tax Paid | Tax Assessment Tax Assessment Total Assessment is a certain percentage of the fair market value that is determined by local assessors to be the total taxable value of land and additions on the property. | Land | Improvement |
|---|---|---|---|---|
| 2025 | $2,830 | $277,180 | $39,735 | $237,445 |
| 2023 | $2,830 | $255,985 | $28,040 | $227,945 |
| 2022 | $2,727 | $218,110 | $16,995 | $201,115 |
| 2021 | $2,795 | $218,110 | $16,995 | $201,115 |
| 2020 | $2,339 | $206,120 | $18,885 | $187,235 |
| 2018 | $2,924 | $175,040 | $42,500 | $132,540 |
| 2017 | $2,397 | $175,040 | $42,500 | $132,540 |
| 2016 | $2,306 | $155,220 | $40,500 | $114,720 |
| 2015 | $2,306 | $151,880 | $40,500 | $111,380 |
| 2014 | -- | $149,765 | $39,500 | $110,265 |
| 2013 | -- | $141,085 | $37,500 | $103,585 |
Source: Public Records
Map
Nearby Homes
- 19 Christmas Tree Ln
- 6 Noel Ln
- 4 Christmas Tree Ln
- 341 E Island Lake Dr
- 381 E Island Lake Dr
- 217 Parsley Ave
- 54 Basil Ave
- 89 Basil Ave
- 70 E Beaumont Dr Unit A
- 1533 Northcliff Rd
- 1591 E Island Lake Dr
- 1311 E Island Lake Dr
- 2227 Washington St
- 1 E Fir Ct Unit Div 2
- 1 E Fir Ct
- 1125 N 13th (Lot D) St Unit Lot D
- 1125 N 13th (Lot F) St Unit LOT F
- 1604 King St
- 15501 Highway 101
- 1720 Jefferson St
- 377 E Springfield Loop
- 357 E Springfield Loop
- 215 E Springfield Loop
- 219 E Springfield Loop
- 209 E Springfield Loop
- 349 E Springfield Loop
- 368 E Springfield Loop
- 229 E Springfield Loop
- 360 E Springfield Loop
- 376 E Springfield Loop
- 205 E Springfield Loop
- 339 E Springfield Loop
- 419 E Springfield Loop
- 402 E Springfield Loop
- 237 E Springfield Loop
- 344 E Springfield Loop
- 515 E Springfield Loop
- 509 E Springfield Loop
- 333 E Springfield Loop
Your Personal Tour Guide
Ask me questions while you tour the home.