B
Landlord's Agent in 2024
Brad Roszell
Casa Dulce Realty
(512) 815-9952
4 Total Sales
Estimated Value: $536,000 - $730,000
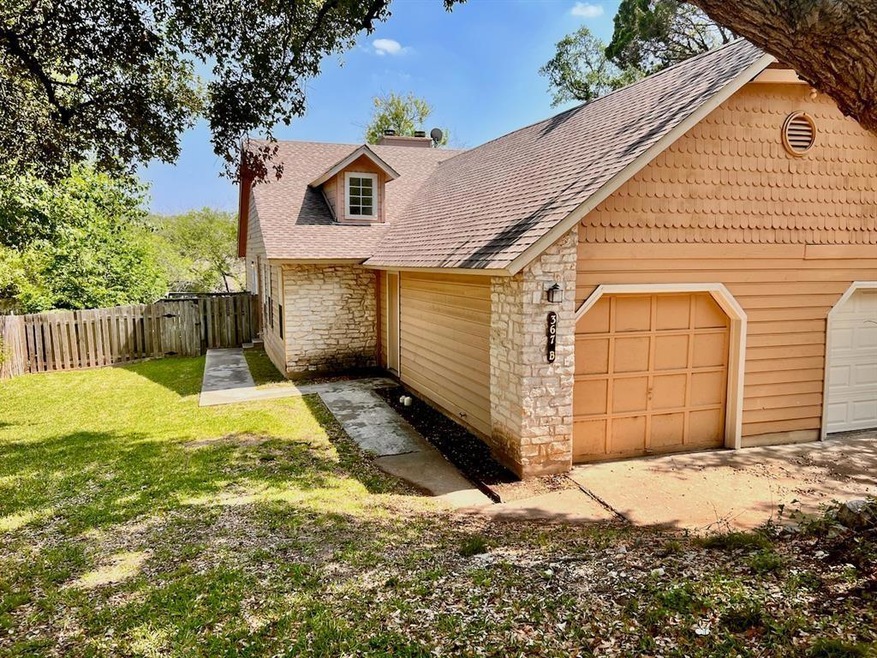
2/2 Lakeway duplex now available! Large, open tiled-floor living room with wood-burning fireplace, opens to kitchen with breakfast bar and separate dining area. Galley kitchen with fridge, dishwasher, electric range and pantry. Primary bedroom has high ceiling with skylight, ensuite bath and large closet. 2nd bedroom with plenty of space and FULL 2nd bathroom. Single car garage with washer/dryer hookups. Back deck steps down into spacious fenced yard, private from other unit. Turn-key and for new tenants ASAP w/ initial lease term to run through June of 2024 - OR - either 4/31 or 6/30 2025(12 month renewal available after initial lease). Pets welcome for additional fees/deposit, but see size/breed restrictions. **FIRST QUALIFIED LISTING** We take applications on a first come basis and do not accept competing bids. Applicants must show gross household income 3x the rental amount, and have good past rental/ownership history(no late payments or broken leases)
Last Agent to Rent the Property
Casa Dulce Realty Brokerage Phone: (512) 345-6355 License #0652844 Listed on: 10/20/2023
Last Renter's Agent
Casa Dulce Realty Brokerage Phone: (512) 345-6355 License #0652844 Listed on: 10/20/2023
| Date | Buyer | Sale Price | Title Company |
|---|---|---|---|
| Trillium Properties Llc | -- | None Available |
| Date | Event | Price | List to Sale | Price per Sq Ft |
|---|---|---|---|---|
| 02/16/2024 02/16/24 | Rented | $1,450 | 0.0% | -- |
| 02/11/2024 02/11/24 | Under Contract | -- | -- | -- |
| 02/06/2024 02/06/24 | Price Changed | $1,450 | -3.0% | $1 / Sq Ft |
| 01/03/2024 01/03/24 | Price Changed | $1,495 | -6.3% | $1 / Sq Ft |
| 10/20/2023 10/20/23 | For Rent | $1,595 | -8.9% | -- |
| 07/29/2023 07/29/23 | Rented | $1,750 | 0.0% | -- |
| 07/10/2023 07/10/23 | Under Contract | -- | -- | -- |
| 05/09/2023 05/09/23 | For Rent | $1,750 | +20.7% | -- |
| 07/23/2021 07/23/21 | Rented | $1,450 | 0.0% | -- |
| 07/12/2021 07/12/21 | Under Contract | -- | -- | -- |
| 07/11/2021 07/11/21 | For Rent | $1,450 | +21.3% | -- |
| 10/01/2018 10/01/18 | Rented | $1,195 | 0.0% | -- |
| 09/20/2018 09/20/18 | Under Contract | -- | -- | -- |
| 09/10/2018 09/10/18 | Price Changed | $1,195 | -4.4% | $1 / Sq Ft |
| 08/18/2018 08/18/18 | Price Changed | $1,250 | -3.5% | $1 / Sq Ft |
| 07/26/2018 07/26/18 | Price Changed | $1,295 | -7.2% | $1 / Sq Ft |
| 06/04/2018 06/04/18 | For Rent | $1,395 | +16.7% | -- |
| 08/07/2017 08/07/17 | Rented | $1,195 | 0.0% | -- |
| 07/28/2017 07/28/17 | Under Contract | -- | -- | -- |
| 07/27/2017 07/27/17 | Price Changed | $1,195 | -4.4% | $1 / Sq Ft |
| 07/21/2017 07/21/17 | For Rent | $1,250 | 0.0% | -- |
| 07/17/2017 07/17/17 | Under Contract | -- | -- | -- |
| 06/22/2017 06/22/17 | For Rent | $1,250 | +4.2% | -- |
| 09/21/2015 09/21/15 | Rented | $1,200 | 0.0% | -- |
| 09/15/2015 09/15/15 | Under Contract | -- | -- | -- |
| 07/07/2015 07/07/15 | For Rent | $1,200 | +20.0% | -- |
| 08/24/2013 08/24/13 | Rented | $1,000 | 0.0% | -- |
| 08/19/2013 08/19/13 | Under Contract | -- | -- | -- |
| 08/16/2013 08/16/13 | For Rent | $1,000 | +2.6% | -- |
| 07/29/2013 07/29/13 | Rented | $975 | 0.0% | -- |
| 07/16/2013 07/16/13 | Under Contract | -- | -- | -- |
| 07/04/2013 07/04/13 | For Rent | $975 | +2.6% | -- |
| 08/31/2012 08/31/12 | Rented | $950 | 0.0% | -- |
| 08/22/2012 08/22/12 | Under Contract | -- | -- | -- |
| 08/13/2012 08/13/12 | For Rent | $950 | 0.0% | -- |
| 05/10/2012 05/10/12 | Rented | $950 | 0.0% | -- |
| 05/07/2012 05/07/12 | Under Contract | -- | -- | -- |
| 04/28/2012 04/28/12 | For Rent | $950 | -- | -- |
| Year | Tax Paid | Tax Assessment Tax Assessment Total Assessment is a certain percentage of the fair market value that is determined by local assessors to be the total taxable value of land and additions on the property. | Land | Improvement |
|---|---|---|---|---|
| 2025 | $9,479 | $513,271 | $225,020 | $288,251 |
| 2023 | $9,714 | $552,016 | $220,000 | $332,016 |
| 2022 | $9,339 | $489,517 | $200,000 | $289,517 |
| 2021 | $8,129 | $399,262 | $200,000 | $199,262 |
| 2020 | $9,592 | $361,300 | $200,000 | $161,300 |
| 2018 | $7,435 | $325,573 | $200,000 | $125,573 |
| 2017 | $7,633 | $332,000 | $70,000 | $262,000 |
| 2016 | $6,144 | $267,228 | $55,000 | $212,228 |
| 2015 | $4,440 | $249,906 | $55,000 | $194,906 |
| 2014 | $4,440 | $181,686 | $55,000 | $126,686 |
B
Landlord's Agent in 2024
Brad Roszell
Casa Dulce Realty
(512) 815-9952
4 Total Sales

Buyer's Agent in 2021
Brooke Daniel
Compass RE Texas, LLC
(512) 758-2884
37 Total Sales
Seller's Agent in 2018
Greg Fedro
Casa Dulce Realty
(512) 345-9886
13 Total Sales
Buyer's Agent in 2018
Amber Hart
Keller Williams - Lake Travis
(512) 415-9023
91 in this area
231 Total Sales
L
Buyer's Agent in 2017
Lisa Bakken
Central Metro Realty
(512) 626-4990
1 Total Sale
S
Buyer's Agent in 2015
Stephanie Neckar
Keller Williams - Lake Travis
(830) 461-4060
Source: Unlock MLS (Austin Board of REALTORS®)
MLS Number: 2505116
APN: 140011
Disclaimer: Certain information contained herein is derived from information provided by parties other than Homes.com. All information provided is deemed reliable, but is not guaranteed to be accurate and should be independently verified.
![]() Based on information from the Austin Board of REALTORS® (alternatively, from ACTRIS). Neither the Board nor ACTRIS guarantees or is in any way responsible for its accuracy. All data is provided “AS IS” and with all faults. Data maintained by the Board or ACTRIS may not reflect all real estate activity in the market.
Based on information from the Austin Board of REALTORS® (alternatively, from ACTRIS). Neither the Board nor ACTRIS guarantees or is in any way responsible for its accuracy. All data is provided “AS IS” and with all faults. Data maintained by the Board or ACTRIS may not reflect all real estate activity in the market.
Information being provided is for consumers’ personal, non-commercial use and may not be used for any purpose other than to identify prospective properties consumers may be interested in purchasing. All data is obtained from various sources and may not have been verified by broker or MLS GRID. Supplied Open House Information is subject to change without notice. All information should be independently reviewed and verified for accuracy. Properties may or may not be listed by the office/agent presenting the information. Some IDX listings have been excluded from this website.
Based on information submitted to the MLS GRID
Ask me questions while you tour the home.