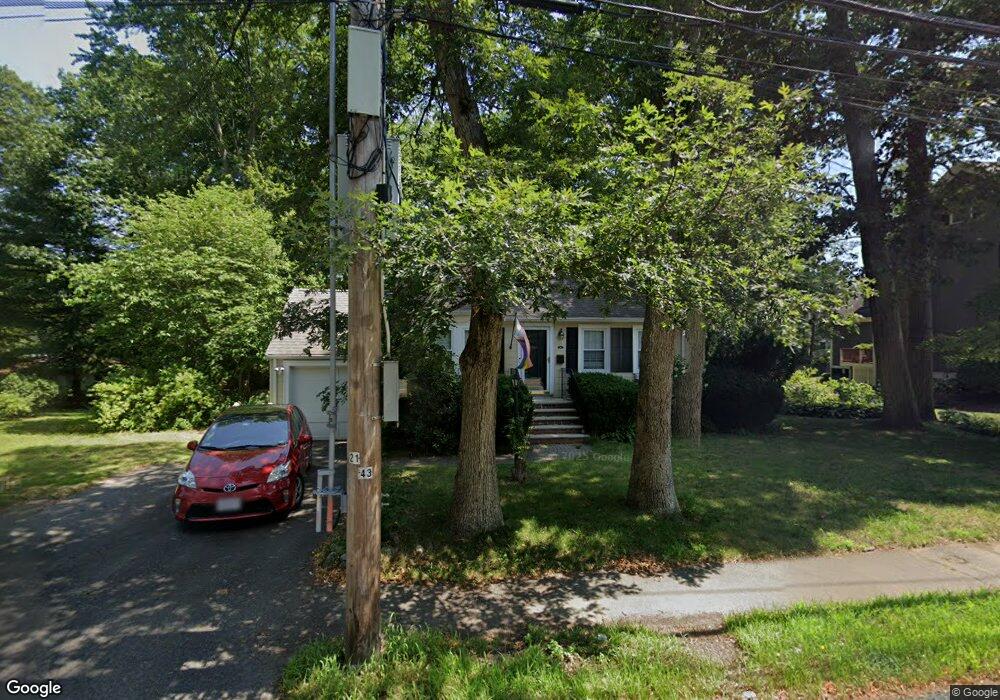
367 High Rock St Needham, MA 02492
Estimated Value: $1,080,000 - $1,160,000
4
Beds
2
Baths
888
Sq Ft
$1,274/Sq Ft
Est. Value
About This Home
This home is located at 367 High Rock St, Needham, MA 02492 and is currently estimated at $1,131,210, approximately $1,273 per square foot. 367 High Rock St is a home located in Norfolk County with nearby schools including Newman Elementary School, High Rock Middle School, and Pollard Middle School.
Ownership History
Date
Name
Owned For
Owner Type
Purchase Details
Closed on
Jul 6, 2023
Sold by
Hausman Jacob and Hausman Rachel R
Bought by
Baer Christopher and Baer-Karnell Jessica E
Current Estimated Value
Home Financials for this Owner
Home Financials are based on the most recent Mortgage that was taken out on this home.
Original Mortgage
$780,000
Outstanding Balance
$754,916
Interest Rate
6.57%
Mortgage Type
Purchase Money Mortgage
Estimated Equity
$376,294
Purchase Details
Closed on
Jun 22, 2012
Sold by
Lepage Elizabeth and Lepage Robert F
Bought by
Rachfal John and Rachfal Amy W
Purchase Details
Closed on
Aug 31, 2001
Sold by
King Yoon and King Andrew D
Bought by
Lepage Elizabeth and Lepage Robert F
Home Financials for this Owner
Home Financials are based on the most recent Mortgage that was taken out on this home.
Original Mortgage
$275,000
Interest Rate
7.06%
Mortgage Type
Purchase Money Mortgage
Purchase Details
Closed on
Feb 24, 2000
Sold by
Holly Mark and Holly Nancy L
Bought by
King Yoon and King Andrew D
Purchase Details
Closed on
Apr 1, 1999
Sold by
Holly Mark and Holly Nancy L
Bought by
King Yoon and King Andrew D
Purchase Details
Closed on
Nov 10, 1988
Sold by
Johnson Patricia
Bought by
Holly Mark
Create a Home Valuation Report for This Property
The Home Valuation Report is an in-depth analysis detailing your home's value as well as a comparison with similar homes in the area
Home Values in the Area
Average Home Value in this Area
Purchase History
We collect this data history from publicly available records. To have your information removed, we recommend requesting removal directly through your county’s website.
| Date | Buyer | Sale Price | Title Company |
|---|---|---|---|
| Baer Christopher | $975,000 | None Available | |
| Rachfal John | $555,000 | -- | |
| Rachfal John | $555,000 | -- | |
| Lepage Elizabeth | $442,000 | -- | |
| King Yoon | $312,000 | -- | |
| King Yoon | $312,000 | -- | |
| Holly Mark | $179,000 | -- |
Source: Public Records
Mortgage History
We collect this data history from publicly available records. To have your information removed, we recommend requesting removal directly through your county’s website.
| Date | Status | Borrower | Loan Amount |
|---|---|---|---|
| Open | Baer Christopher | $780,000 | |
| Previous Owner | Holly Mark | $335,000 | |
| Previous Owner | Holly Mark | $275,000 |
Source: Public Records
Tax History
| Year | Tax Paid | Tax Assessment Tax Assessment Total Assessment is a certain percentage of the fair market value that is determined by local assessors to be the total taxable value of land and additions on the property. | Land | Improvement |
|---|---|---|---|---|
| 2025 | $10,118 | $954,500 | $722,000 | $232,500 |
| 2024 | $10,289 | $821,800 | $527,000 | $294,800 |
| 2023 | $10,402 | $797,700 | $527,000 | $270,700 |
| 2022 | $10,176 | $761,100 | $497,200 | $263,900 |
| 2021 | $9,917 | $761,100 | $497,200 | $263,900 |
| 2020 | $9,350 | $748,600 | $497,200 | $251,400 |
| 2019 | $8,684 | $700,900 | $452,100 | $248,800 |
| 2018 | $8,327 | $700,900 | $452,100 | $248,800 |
| 2017 | $7,972 | $670,500 | $452,100 | $218,400 |
| 2016 | $7,187 | $622,800 | $452,100 | $170,700 |
| 2015 | $7,031 | $622,800 | $452,100 | $170,700 |
| 2014 | $6,720 | $577,300 | $411,100 | $166,200 |
Source: Public Records
Map
Nearby Homes
- 105 Blake St
- 22 Barrett St
- 5 Colonial Rd
- 72 Marked Tree Rd
- 64 Gayland Rd
- 620 High Rock St
- 1360 Great Plain Ave
- 957 South St
- 1362 Great Plain Ave Unit 1
- 34 Pond St
- 20 Burr Dr
- 98 Bridle Trail Rd
- 8 Sutton Rd
- 1069 Central Ave
- 52 Hancock Rd
- 1480 Great Plain Ave
- 131 Fair Oaks Park
- 1 Windsor Rd
- 8 Crestview Rd
- 238 Harris Ave
- 367 High Rock St
- 295 Linden St
- 297 Linden St
- 297 Linden St Unit 297
- 297 Linden St Unit 1
- 9 Robinwood Ave
- 364 High Rock St
- 373 High Rock St
- 352 High Rock St
- 368 High Rock St
- 292 Linden St
- 381 High Rock St
- 290 Linden St
- 11 Robinwood Ave
- 5 Deerfield Rd
- 378 High Rock St
- 14 Robinwood Ave
- 342 High Rock St
- 342 High Rock St
- 342 High Rock St Unit 1
Your Personal Tour Guide
Ask me questions while you tour the home.