Estimated Value: $251,398 - $295,000
3
Beds
2
Baths
1,092
Sq Ft
$252/Sq Ft
Est. Value
About This Home
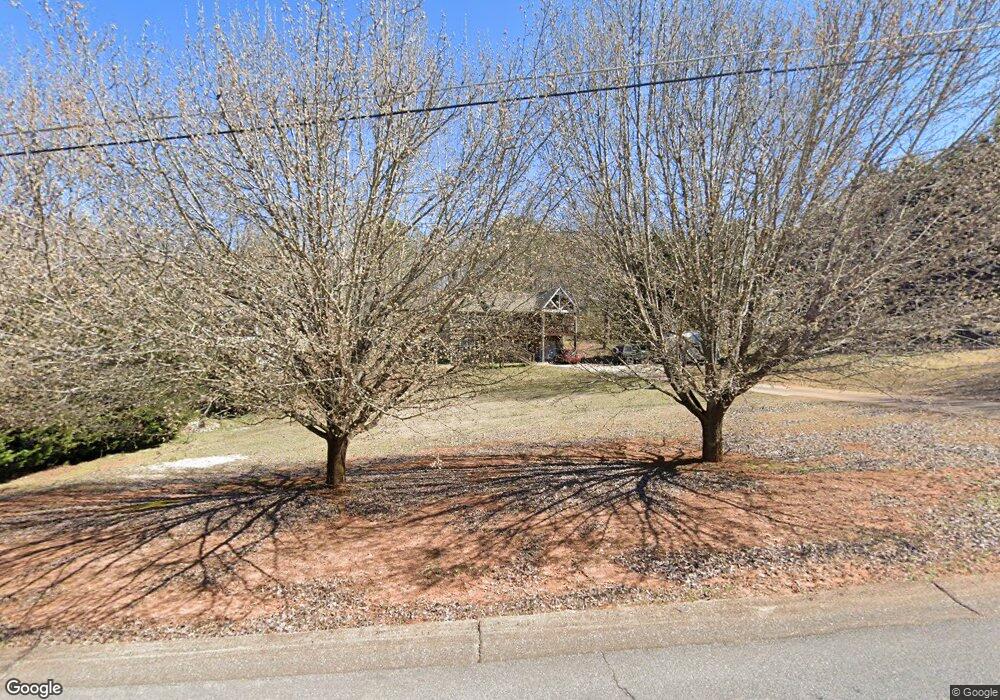
This home is located at 367 Jewel Cole Rd, Hiram, GA 30141 and is currently estimated at $275,100, approximately $251 per square foot. 367 Jewel Cole Rd is a home located in Paulding County with nearby schools including Allgood Elementary School, Herschel Jones Middle School, and Paulding County High School.
Ownership History
Date
Name
Owned For
Owner Type
Purchase Details
Closed on
Aug 3, 2021
Sold by
Palmour Kimberly Paris
Bought by
Palmour Howard Lee
Current Estimated Value
Purchase Details
Closed on
Jul 24, 2018
Sold by
Prator Patricia
Bought by
Palmour Howard Lee and Palmour Kimberly Paris
Home Financials for this Owner
Home Financials are based on the most recent Mortgage that was taken out on this home.
Original Mortgage
$127,187
Interest Rate
4.37%
Mortgage Type
FHA
Purchase Details
Closed on
Mar 23, 2016
Sold by
Prator Russell Edward
Bought by
Prator Patricia
Purchase Details
Closed on
Jun 29, 1995
Sold by
Ltp Constr
Bought by
Prator Russell
Create a Home Valuation Report for This Property
The Home Valuation Report is an in-depth analysis detailing your home's value as well as a comparison with similar homes in the area
Home Values in the Area
Average Home Value in this Area
Purchase History
| Date | Buyer | Sale Price | Title Company |
|---|---|---|---|
| Palmour Howard Lee | -- | -- | |
| Palmour Howard Lee | $150,000 | -- | |
| Prator Patricia | $84,790 | -- | |
| Prator Russell | $64,500 | -- |
Source: Public Records
Mortgage History
| Date | Status | Borrower | Loan Amount |
|---|---|---|---|
| Previous Owner | Palmour Howard Lee | $127,187 | |
| Closed | Prator Russell | $0 |
Source: Public Records
Tax History Compared to Growth
Tax History
| Year | Tax Paid | Tax Assessment Tax Assessment Total Assessment is a certain percentage of the fair market value that is determined by local assessors to be the total taxable value of land and additions on the property. | Land | Improvement |
|---|---|---|---|---|
| 2024 | $2,385 | $99,112 | $12,000 | $87,112 |
| 2023 | $2,628 | $100,820 | $12,000 | $88,820 |
| 2022 | $1,934 | $74,192 | $12,000 | $62,192 |
| 2021 | $1,969 | $67,740 | $8,000 | $59,740 |
| 2020 | $1,806 | $60,800 | $8,000 | $52,800 |
| 2019 | $1,713 | $56,840 | $8,000 | $48,840 |
| 2018 | $1,347 | $46,560 | $8,000 | $38,560 |
| 2017 | $1,188 | $40,760 | $8,000 | $32,760 |
| 2016 | $912 | $30,156 | $8,000 | $22,156 |
| 2015 | $702 | $33,916 | $8,000 | $25,916 |
| 2014 | $634 | $31,212 | $8,000 | $23,212 |
| 2013 | -- | $27,640 | $8,000 | $19,640 |
Source: Public Records
Map
Nearby Homes
- 242 Barrington Dr
- 149 Barrington Ln
- 122 Prince Way
- 1707 Hiram Sudie Rd
- 185 Wyngate Ct
- 72 Victorian Cir
- 180 Kensington Path
- 581 Victorian Cir
- 426 Old Sudie Rd
- 51 Old Teal Rd
- 39 Bent Creek Ct
- 520 White Pines Dr
- 142 Wellspring Point
- 237 Settlers Mill Run
- 14 Woodmill Ct Unit 2
- 55 Jessica Dr
- 164 Emerald Pines Ln
- 367 Jewell Cole Rd
- 335 Jewel Cole Rd
- 407 Jewel Cole Rd
- 335 Jewell Cole Rd
- 19 Westin Dr
- 427 Jewell Cole Rd
- 427 Jewel Cole Rd
- 396 Jewel Cole Rd
- 311 Jewell Cole Rd
- 374 Jewel Cole Rd
- 418 Jewel Cole Rd
- 418 Jewell Cole Rd
- 49 Westin Dr
- 439 Jewell Cole Rd
- 18 Westin Dr
- 439 Jewel Cole Rd
- 79 Westin Dr
- 1386 Cochran Ridge Rd
- 296 Jewel Cole Rd
- 42 Westin Dr