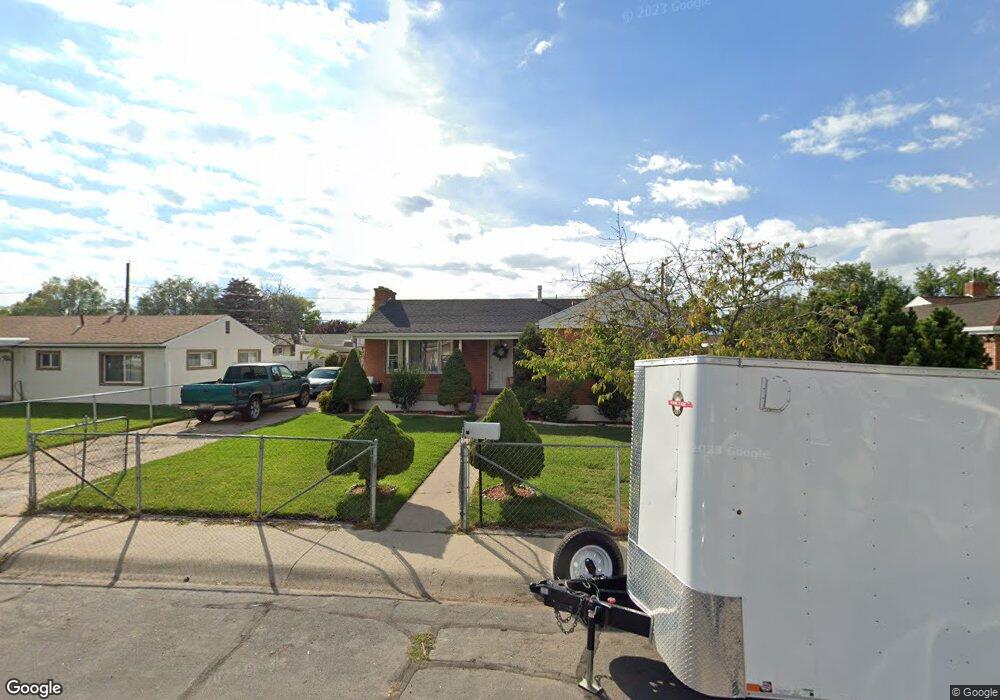
367 N 725 W Orem, UT 84057
Suncrest NeighborhoodEstimated Value: $422,000 - $461,034
4
Beds
2
Baths
1,808
Sq Ft
$242/Sq Ft
Est. Value
About This Home
This home is located at 367 N 725 W, Orem, UT 84057 and is currently estimated at $437,759, approximately $242 per square foot. 367 N 725 W is a home located in Utah County with nearby schools including Orem Junior High School, Mountain View High School, and Noah Webster Academy.
Ownership History
Date
Name
Owned For
Owner Type
Purchase Details
Closed on
Apr 30, 2007
Sold by
Reynaga Jose and Reynaga Alma
Bought by
Reynaga Rigoberto
Current Estimated Value
Home Financials for this Owner
Home Financials are based on the most recent Mortgage that was taken out on this home.
Original Mortgage
$132,200
Outstanding Balance
$88,309
Interest Rate
8.05%
Mortgage Type
Purchase Money Mortgage
Estimated Equity
$349,450
Purchase Details
Closed on
May 25, 1999
Sold by
Spotts Brian T and Spotts Linda M
Bought by
Reynaga Jose and Reynaga Alma
Home Financials for this Owner
Home Financials are based on the most recent Mortgage that was taken out on this home.
Original Mortgage
$122,648
Interest Rate
6.86%
Mortgage Type
FHA
Create a Home Valuation Report for This Property
The Home Valuation Report is an in-depth analysis detailing your home's value as well as a comparison with similar homes in the area
Home Values in the Area
Average Home Value in this Area
Purchase History
| Date | Buyer | Sale Price | Title Company |
|---|---|---|---|
| Reynaga Rigoberto | -- | Gt Title Services Spanish | |
| Reynaga Jose | -- | First American Title Co |
Source: Public Records
Mortgage History
| Date | Status | Borrower | Loan Amount |
|---|---|---|---|
| Open | Reynaga Rigoberto | $132,200 | |
| Previous Owner | Reynaga Jose | $122,648 |
Source: Public Records
Tax History
| Year | Tax Paid | Tax Assessment Tax Assessment Total Assessment is a certain percentage of the fair market value that is determined by local assessors to be the total taxable value of land and additions on the property. | Land | Improvement |
|---|---|---|---|---|
| 2025 | $1,677 | $223,245 | -- | -- |
| 2024 | $1,677 | $205,040 | $0 | $0 |
| 2023 | $1,540 | $202,345 | $0 | $0 |
| 2022 | $1,535 | $195,415 | $0 | $0 |
| 2021 | $1,388 | $267,600 | $106,800 | $160,800 |
| 2020 | $1,274 | $241,500 | $85,400 | $156,100 |
| 2019 | $1,122 | $221,100 | $85,400 | $135,700 |
| 2018 | $1,063 | $200,100 | $82,100 | $118,000 |
| 2017 | $992 | $100,045 | $0 | $0 |
| 2016 | $916 | $85,250 | $0 | $0 |
| 2015 | $942 | $82,885 | $0 | $0 |
| 2014 | $938 | $82,170 | $0 | $0 |
Source: Public Records
Map
Nearby Homes
Your Personal Tour Guide
Ask me questions while you tour the home.