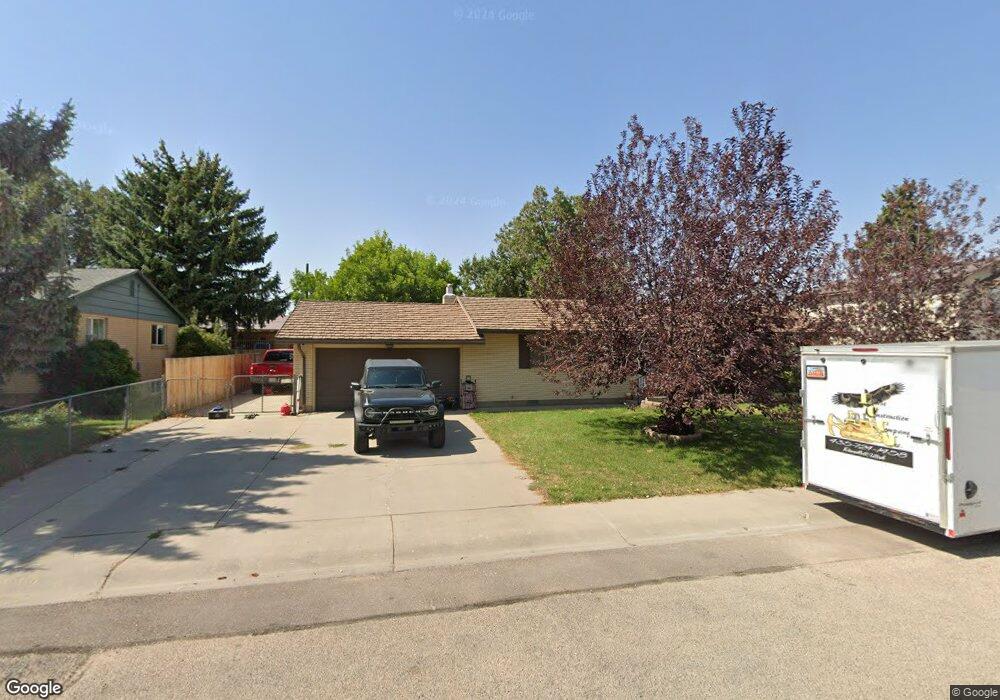
367 N 850 W Vernal, UT 84078
Estimated Value: $309,816 - $371,000
3
Beds
2
Baths
1,332
Sq Ft
$252/Sq Ft
Est. Value
About This Home
This home is located at 367 N 850 W, Vernal, UT 84078 and is currently estimated at $336,204, approximately $252 per square foot. 367 N 850 W is a home located in Uintah County with nearby schools including Ashley School, Uintah Middle School, and Vernal Middle School.
Ownership History
Date
Name
Owned For
Owner Type
Purchase Details
Closed on
May 15, 2020
Sold by
Boyd and Franklin Richard
Bought by
Ames Cassee J
Current Estimated Value
Home Financials for this Owner
Home Financials are based on the most recent Mortgage that was taken out on this home.
Original Mortgage
$189,344
Outstanding Balance
$167,417
Interest Rate
3.3%
Mortgage Type
New Conventional
Estimated Equity
$168,787
Purchase Details
Closed on
Apr 27, 2011
Sold by
Dale Urban
Bought by
Federal Home Loan Mortgage Corporation
Purchase Details
Closed on
Jun 17, 2008
Sold by
Ruggeri James Samuel and Ruggeri Tricia Lynn
Bought by
Urban Dale
Home Financials for this Owner
Home Financials are based on the most recent Mortgage that was taken out on this home.
Original Mortgage
$157,600
Interest Rate
6.04%
Mortgage Type
New Conventional
Create a Home Valuation Report for This Property
The Home Valuation Report is an in-depth analysis detailing your home's value as well as a comparison with similar homes in the area
Home Values in the Area
Average Home Value in this Area
Purchase History
| Date | Buyer | Sale Price | Title Company |
|---|---|---|---|
| Ames Cassee J | -- | None Available | |
| Federal Home Loan Mortgage Corporation | $141,418 | -- | |
| Urban Dale | -- | -- |
Source: Public Records
Mortgage History
| Date | Status | Borrower | Loan Amount |
|---|---|---|---|
| Open | Ames Cassee J | $189,344 | |
| Previous Owner | Urban Dale | $157,600 |
Source: Public Records
Tax History Compared to Growth
Tax History
| Year | Tax Paid | Tax Assessment Tax Assessment Total Assessment is a certain percentage of the fair market value that is determined by local assessors to be the total taxable value of land and additions on the property. | Land | Improvement |
|---|---|---|---|---|
| 2024 | $1,334 | $149,904 | $19,337 | $130,567 |
| 2023 | $1,321 | $127,722 | $18,577 | $109,145 |
| 2022 | $1,144 | $105,893 | $18,577 | $87,316 |
| 2021 | $1,172 | $89,566 | $18,577 | $70,989 |
| 2020 | $1,122 | $88,174 | $18,577 | $69,597 |
| 2019 | $1,087 | $84,325 | $19,250 | $65,075 |
| 2018 | $1,048 | $81,227 | $19,250 | $61,977 |
| 2017 | $11 | $83,977 | $22,000 | $61,977 |
| 2016 | $1,089 | $92,993 | $22,000 | $70,993 |
| 2015 | $1,047 | $96,730 | $22,000 | $74,730 |
| 2014 | $990 | $92,757 | $22,000 | $70,757 |
| 2013 | $1,012 | $92,757 | $22,000 | $70,757 |
Source: Public Records
Map
Nearby Homes