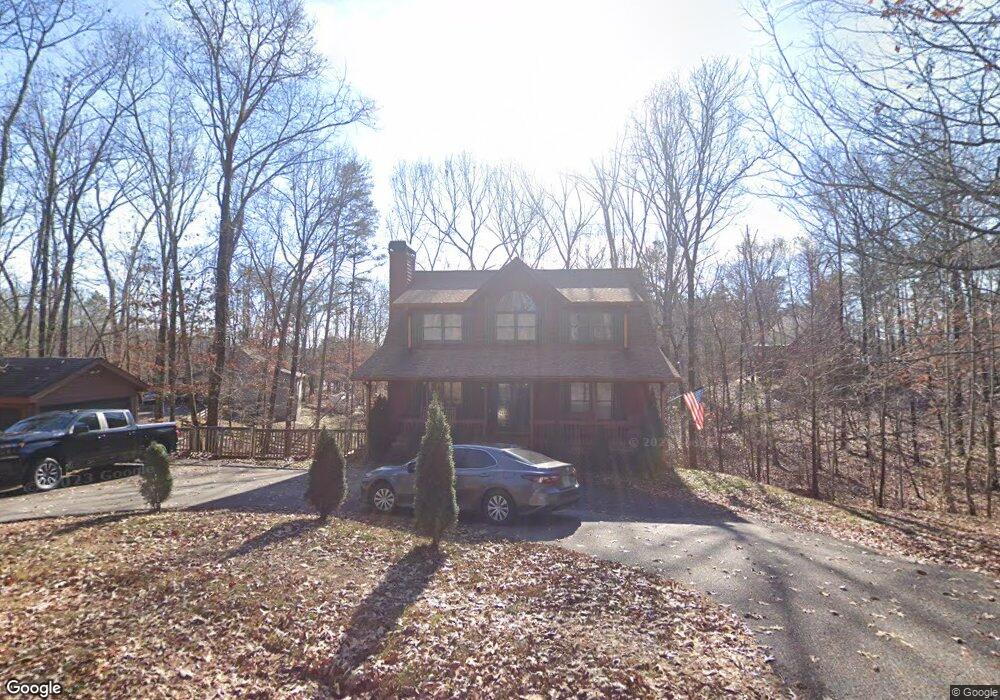
367 River Flow Dr Unit 5 Dahlonega, GA 30533
Estimated Value: $360,605 - $411,000
3
Beds
3
Baths
1,612
Sq Ft
$240/Sq Ft
Est. Value
About This Home
This home is located at 367 River Flow Dr Unit 5, Dahlonega, GA 30533 and is currently estimated at $386,901, approximately $240 per square foot. 367 River Flow Dr Unit 5 is a home located in Lumpkin County with nearby schools including Lumpkin County High School.
Ownership History
Date
Name
Owned For
Owner Type
Purchase Details
Closed on
Jul 25, 2013
Sold by
Maher Ruth
Bought by
Reynolds Janet L and Reynolds Alan M
Current Estimated Value
Home Financials for this Owner
Home Financials are based on the most recent Mortgage that was taken out on this home.
Original Mortgage
$144,000
Outstanding Balance
$107,258
Interest Rate
4.43%
Mortgage Type
New Conventional
Estimated Equity
$279,643
Purchase Details
Closed on
Oct 10, 2008
Sold by
Giltzow Jeffrey L
Bought by
Maher Ruth
Home Financials for this Owner
Home Financials are based on the most recent Mortgage that was taken out on this home.
Original Mortgage
$157,500
Interest Rate
5.96%
Mortgage Type
New Conventional
Purchase Details
Closed on
Oct 19, 2006
Sold by
Not Provided
Bought by
Maher Ruth
Home Financials for this Owner
Home Financials are based on the most recent Mortgage that was taken out on this home.
Original Mortgage
$182,848
Interest Rate
6.31%
Mortgage Type
VA
Purchase Details
Closed on
Nov 10, 2004
Bought by
Hayes Greg and Hayes Ricky
Create a Home Valuation Report for This Property
The Home Valuation Report is an in-depth analysis detailing your home's value as well as a comparison with similar homes in the area
Home Values in the Area
Average Home Value in this Area
Purchase History
| Date | Buyer | Sale Price | Title Company |
|---|---|---|---|
| Reynolds Janet L | $160,000 | -- | |
| Maher Ruth | $175,000 | -- | |
| Maher Ruth | $179,000 | -- | |
| Hayes Greg | $244,500 | -- |
Source: Public Records
Mortgage History
| Date | Status | Borrower | Loan Amount |
|---|---|---|---|
| Open | Reynolds Janet L | $144,000 | |
| Previous Owner | Maher Ruth | $157,500 | |
| Previous Owner | Maher Ruth | $182,848 |
Source: Public Records
Tax History Compared to Growth
Tax History
| Year | Tax Paid | Tax Assessment Tax Assessment Total Assessment is a certain percentage of the fair market value that is determined by local assessors to be the total taxable value of land and additions on the property. | Land | Improvement |
|---|---|---|---|---|
| 2024 | $2,648 | $116,501 | $12,000 | $104,501 |
| 2023 | $2,117 | $109,564 | $12,000 | $97,564 |
| 2022 | $2,345 | $96,739 | $12,000 | $84,739 |
| 2021 | $2,058 | $82,381 | $12,000 | $70,381 |
| 2020 | $2,069 | $80,445 | $12,000 | $68,445 |
| 2019 | $2,088 | $80,445 | $12,000 | $68,445 |
| 2018 | $1,993 | $72,234 | $12,000 | $60,234 |
| 2017 | $1,940 | $69,070 | $12,000 | $57,070 |
| 2016 | $1,860 | $64,180 | $12,000 | $52,180 |
| 2015 | $1,687 | $64,180 | $12,000 | $52,180 |
| 2014 | $1,687 | $64,804 | $12,000 | $52,804 |
| 2013 | -- | $65,426 | $12,000 | $53,426 |
Source: Public Records
Map
Nearby Homes
- 190 Grand Oak Ln
- 221 Laurel Cir
- 486 Laurel Cir
- 191 Sleepy Hollow Rd
- 15 Baker St
- 0 Rainmore Dr Unit 7620063
- 0 Rainmore Dr Unit 10570615
- 103 Rainmore Dr
- 150 Buck Run E
- 33 Tj Mote Rd
- 33 T J Mote Rd
- 50 Loyal Dr
- 194 Deerfield Dr
- 775 Crooked Creek Dr
- 0 Honey Tree Terrace Unit 10448792
- 0 Honey Tree Terrace Unit 7516071
- 251 Bearslide Hollow
- Lot 5 Still Rd
- 1044 Rider Rd
- 239 Castleberry Ln
- 367 River Flow Dr
- Lot 4 Misty Hollow
- 0 Misty Hollow Dr Unit 7463668
- 0 Misty Hollow Dr Unit 9042679
- 0 Misty Hollow Dr Unit 3125007
- 0 Misty Hollow Dr Unit 3124926
- 0 Misty Hollow Dr Unit 3124982
- 0 Misty Hollow Dr Unit 7154250
- 0 Misty Hollow Dr
- 40 Misty Hollow Dr
- 445 River Flow Dr
- 345 River Flow Dr
- 33 Misty Hollow Dr
- 60 Misty Hollow Dr
- 230 Misty Hollow Dr
- 325 River Flow Dr
- 325 River Flow Dr Unit 1
- 74 Misty Hollow Dr
- 336 River Flow Dr
- 85 Misty Hollow Dr Unit 17