Estimated Value: $317,622 - $354,000
3
Beds
3
Baths
1,494
Sq Ft
$225/Sq Ft
Est. Value
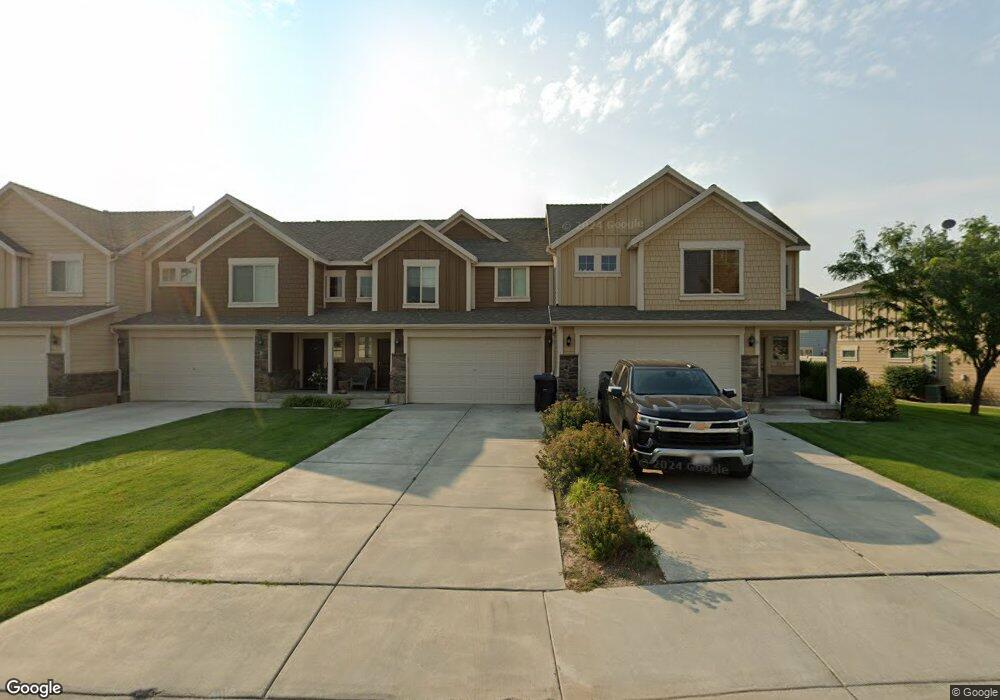
About This Home
This home is located at 367 S 1285 E, Hyrum, UT 84319 and is currently estimated at $336,156, approximately $225 per square foot. 367 S 1285 E is a home located in Cache County with nearby schools including Canyon School, South Cache Middle School, and Mountain Crest High School.
Ownership History
Date
Name
Owned For
Owner Type
Purchase Details
Closed on
May 19, 2016
Sold by
Mcneece Jason L and Mcneece Carrol L
Bought by
Brady Corey and Brady Tiffany
Current Estimated Value
Home Financials for this Owner
Home Financials are based on the most recent Mortgage that was taken out on this home.
Original Mortgage
$155,681
Outstanding Balance
$123,312
Interest Rate
3.59%
Mortgage Type
New Conventional
Estimated Equity
$212,844
Purchase Details
Closed on
Jun 30, 2009
Sold by
Elk Mountain 150 Llc
Bought by
Mcneece Jason L and Mcneece Carrol L
Home Financials for this Owner
Home Financials are based on the most recent Mortgage that was taken out on this home.
Original Mortgage
$133,659
Interest Rate
4.79%
Mortgage Type
FHA
Purchase Details
Closed on
Mar 9, 2009
Sold by
Mckay Dev Hyrum Llc
Bought by
Elk Mountain 150 Llc
Create a Home Valuation Report for This Property
The Home Valuation Report is an in-depth analysis detailing your home's value as well as a comparison with similar homes in the area
Home Values in the Area
Average Home Value in this Area
Purchase History
| Date | Buyer | Sale Price | Title Company |
|---|---|---|---|
| Brady Corey | -- | Pinnacle Title | |
| Mcneece Jason L | -- | Heritage Title | |
| Elk Mountain 150 Llc | -- | Heritage Title |
Source: Public Records
Mortgage History
| Date | Status | Borrower | Loan Amount |
|---|---|---|---|
| Open | Brady Corey | $155,681 | |
| Previous Owner | Mcneece Jason L | $133,659 |
Source: Public Records
Tax History
| Year | Tax Paid | Tax Assessment Tax Assessment Total Assessment is a certain percentage of the fair market value that is determined by local assessors to be the total taxable value of land and additions on the property. | Land | Improvement |
|---|---|---|---|---|
| 2025 | $1,171 | $168,080 | $0 | $0 |
| 2024 | $1,276 | $171,120 | $0 | $0 |
| 2023 | $1,582 | $202,785 | $0 | $0 |
| 2022 | $1,539 | $189,035 | $0 | $0 |
| 2021 | $1,269 | $240,150 | $55,000 | $185,150 |
| 2020 | $1,216 | $216,000 | $55,000 | $161,000 |
| 2019 | $1,037 | $173,176 | $25,000 | $148,176 |
| 2018 | $974 | $157,300 | $25,000 | $132,300 |
| 2017 | $991 | $83,050 | $0 | $0 |
| 2016 | $1,013 | $72,425 | $0 | $0 |
| 2015 | $886 | $72,425 | $0 | $0 |
| 2014 | $866 | $72,425 | $0 | $0 |
| 2013 | -- | $71,545 | $0 | $0 |
Source: Public Records
Map
Nearby Homes
- 369 S 1285 E
- 363 S 1285 E
- 361 S 1285 E
- 382 S 1320 E
- 378 S 1320 E Unit 170
- 378 S 1320 E
- 384 S 1320 E Unit 168
- 384 S 1320 E
- 376 S 1320 E Unit 171
- 381 S 1285 E Unit 154
- 381 S 1285 E
- 387 S 1285 E Unit 155
- 354 S 1285 E Unit 147
- 354 S 1285 E
- 356 S 1285 E Unit 146
- 356 S 1285 E
- 352 S 1285 E Unit 148
- 358 S 1285 E Unit 145
- 348 S 1285 E Unit 149
- 348 S 1285 E
Your Personal Tour Guide
Ask me questions while you tour the home.