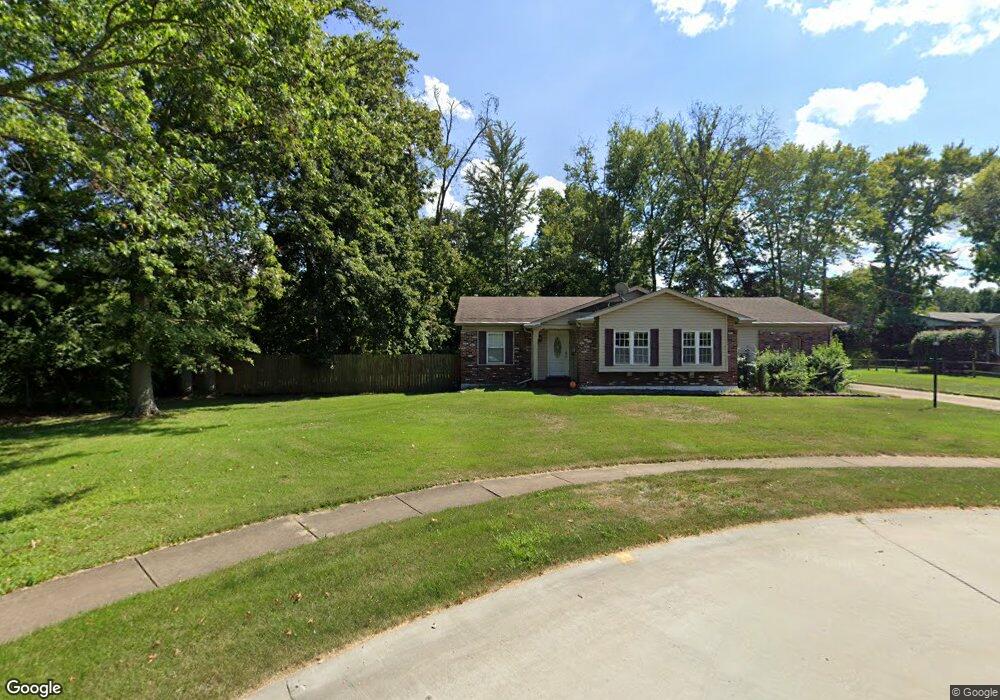
3670 Birchbark Dr Florissant, MO 63033
Estimated Value: $237,000 - $253,000
3
Beds
3
Baths
1,590
Sq Ft
$152/Sq Ft
Est. Value
About This Home
This home is located at 3670 Birchbark Dr, Florissant, MO 63033 and is currently estimated at $242,258, approximately $152 per square foot. 3670 Birchbark Dr is a home located in St. Louis County with nearby schools including Commons Lane Elementary School, Cross Keys Middle School, and McCluer North High School.
Ownership History
Date
Name
Owned For
Owner Type
Purchase Details
Closed on
Mar 29, 2010
Sold by
Cody Properties Llc
Bought by
Aubuchon Sylvia
Current Estimated Value
Home Financials for this Owner
Home Financials are based on the most recent Mortgage that was taken out on this home.
Original Mortgage
$123,619
Outstanding Balance
$82,014
Interest Rate
5%
Mortgage Type
FHA
Estimated Equity
$160,244
Purchase Details
Closed on
Oct 26, 2009
Sold by
Wilkins Jody M and Wilkins Norman A
Bought by
Cody Properties Llc
Purchase Details
Closed on
May 22, 2006
Sold by
Wilkins Norman A and Wilkins Jody M
Bought by
Wilkins Norman A and Wilkins Jody M
Home Financials for this Owner
Home Financials are based on the most recent Mortgage that was taken out on this home.
Original Mortgage
$168,300
Interest Rate
6.5%
Mortgage Type
Fannie Mae Freddie Mac
Purchase Details
Closed on
Oct 21, 2004
Sold by
Gooch Edward L and Gooch Edith L
Bought by
Wilkins Norman A and Wilkins Jody A
Home Financials for this Owner
Home Financials are based on the most recent Mortgage that was taken out on this home.
Original Mortgage
$114,320
Interest Rate
7.55%
Mortgage Type
Purchase Money Mortgage
Create a Home Valuation Report for This Property
The Home Valuation Report is an in-depth analysis detailing your home's value as well as a comparison with similar homes in the area
Home Values in the Area
Average Home Value in this Area
Purchase History
| Date | Buyer | Sale Price | Title Company |
|---|---|---|---|
| Aubuchon Sylvia | $125,900 | None Available | |
| Cody Properties Llc | $74,376 | None Available | |
| Wilkins Norman A | -- | Clt | |
| Wilkins Norman A | $142,900 | Emmons Title Co |
Source: Public Records
Mortgage History
| Date | Status | Borrower | Loan Amount |
|---|---|---|---|
| Open | Aubuchon Sylvia | $123,619 | |
| Previous Owner | Wilkins Norman A | $168,300 | |
| Previous Owner | Wilkins Norman A | $114,320 | |
| Closed | Wilkins Norman A | $28,580 |
Source: Public Records
Tax History Compared to Growth
Tax History
| Year | Tax Paid | Tax Assessment Tax Assessment Total Assessment is a certain percentage of the fair market value that is determined by local assessors to be the total taxable value of land and additions on the property. | Land | Improvement |
|---|---|---|---|---|
| 2025 | $2,970 | $45,160 | $7,350 | $37,810 |
| 2024 | $2,970 | $38,560 | $4,850 | $33,710 |
| 2023 | $2,960 | $38,560 | $4,850 | $33,710 |
| 2022 | $2,700 | $30,910 | $7,350 | $23,560 |
| 2021 | $2,654 | $30,910 | $7,350 | $23,560 |
| 2020 | $2,509 | $27,400 | $7,240 | $20,160 |
| 2019 | $2,459 | $27,400 | $7,240 | $20,160 |
| 2018 | $2,527 | $25,160 | $2,490 | $22,670 |
| 2017 | $2,513 | $25,160 | $2,490 | $22,670 |
| 2016 | $2,544 | $24,830 | $3,250 | $21,580 |
| 2015 | $2,560 | $24,830 | $3,250 | $21,580 |
| 2014 | $2,478 | $24,820 | $6,290 | $18,530 |
Source: Public Records
Map
Nearby Homes
- 990 Saddle Dr
- 3475 Stonehaven Dr
- 3940 Parker Rd
- 3515 Saint Catherine St
- 3435 Saint Catherine St
- 2520 Greenberry Dr
- 3150 Parker Rd
- 3190 N Waterford Dr
- 1540 Ascot Terrace
- 670 Hargrove Ln
- 2320 Greenberry Dr
- 3870 Woodcrest Dr
- 2255 Wheatfield Dr
- 3140 Saint Catherine St
- 1945 Pohlman Rd
- 4040 Helmkampf Dr
- 12415 Danube Dr
- 3 Wild Ridge Estates Turnberry Ct
- 100 Broadmere Dr
- 1670 Aqueduct Dr
- 3650 Birchbark Dr
- 7 Brookstone Ct
- 2935 Derhake Rd
- 3645 Birchbark Dr
- 3630 Birchbark Dr
- 6 Brookstone Ct
- 8 Brookstone Ct
- 2915 Derhake Rd
- 3750 Parker Rd
- 3625 Birchbark Dr
- 3580 Birchbark Dr
- 5 Brookstone Ct
- 2875 Derhake Rd
- 9 Brookstone Ct
- 2841 Cranberry Ct
- 4 Brookstone Ct
- 3655 Amblewood Dr
- 7 Kenstone Ct
- 2855 Derhake Rd
- 10 Brookstone Ct