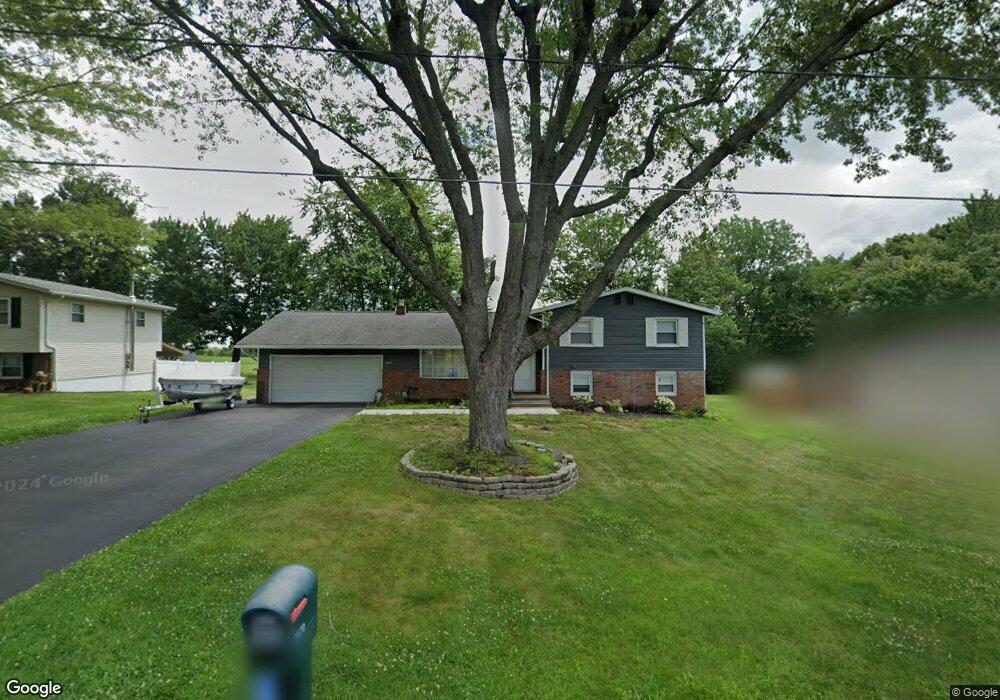
3670 Fall Ave SW Canton, OH 44706
Estimated Value: $155,000 - $214,000
4
Beds
2
Baths
1,188
Sq Ft
$163/Sq Ft
Est. Value
About This Home
This home is located at 3670 Fall Ave SW, Canton, OH 44706 and is currently estimated at $193,086, approximately $162 per square foot. 3670 Fall Ave SW is a home located in Stark County with nearby schools including Pfeiffer Intermediate School, Edison Middle School, and Perry High School.
Ownership History
Date
Name
Owned For
Owner Type
Purchase Details
Closed on
Oct 14, 2020
Sold by
Faircrest Properties Ltd
Bought by
Magee Jeffrey P
Current Estimated Value
Home Financials for this Owner
Home Financials are based on the most recent Mortgage that was taken out on this home.
Original Mortgage
$75,000
Interest Rate
2.9%
Mortgage Type
New Conventional
Purchase Details
Closed on
Sep 6, 2005
Sold by
Bolgrin Gale C
Bought by
Faircrest Properties Ltd
Purchase Details
Closed on
Aug 31, 2005
Sold by
Hayes Laurel Ann and Hayes David
Bought by
Bolgrin Gale C
Purchase Details
Closed on
May 16, 2005
Sold by
Bolgrin Gale C
Bought by
Hayes Laurel Ann and Bolgrin David G
Purchase Details
Closed on
Apr 28, 2005
Sold by
Estate Of Alice Rae Bolgrin
Bought by
Bolgrin Gale C
Purchase Details
Closed on
Jul 19, 1994
Sold by
Bolgrin Gale C
Bought by
Saltalamacchia Susan
Create a Home Valuation Report for This Property
The Home Valuation Report is an in-depth analysis detailing your home's value as well as a comparison with similar homes in the area
Home Values in the Area
Average Home Value in this Area
Purchase History
| Date | Buyer | Sale Price | Title Company |
|---|---|---|---|
| Magee Jeffrey P | $90,000 | None Available | |
| Faircrest Properties Ltd | $136,000 | -- | |
| Hayes Laurel Ann | -- | -- | |
| Bolgrin Gale C | -- | -- | |
| Hayes Laurel Ann | -- | -- | |
| Bolgrin Gale C | -- | -- | |
| Saltalamacchia Susan | $9,000 | -- |
Source: Public Records
Mortgage History
| Date | Status | Borrower | Loan Amount |
|---|---|---|---|
| Previous Owner | Magee Jeffrey P | $75,000 |
Source: Public Records
Tax History
| Year | Tax Paid | Tax Assessment Tax Assessment Total Assessment is a certain percentage of the fair market value that is determined by local assessors to be the total taxable value of land and additions on the property. | Land | Improvement |
|---|---|---|---|---|
| 2025 | -- | $55,440 | $17,360 | $38,080 |
| 2024 | -- | $55,440 | $17,360 | $38,080 |
| 2023 | $2,626 | $52,370 | $12,360 | $40,010 |
| 2022 | $2,640 | $52,370 | $12,360 | $40,010 |
| 2021 | $2,811 | $52,370 | $12,360 | $40,010 |
| 2020 | $2,559 | $44,770 | $10,400 | $34,370 |
| 2019 | $2,166 | $42,010 | $10,400 | $31,610 |
Source: Public Records
Map
Nearby Homes
- 0 Navarre Rd SW Unit 5197934
- 0 Navarre Rd SW Unit 5093073
- 6101 Skylark St SW
- 6070 Highton St SW
- 2858 Lombardi Ave SW
- 6446 Navarre Rd SW
- 5620 Nave St SW
- 5777 Nave St SW
- 5235 Nave St SW
- 6122 Lavenham Rd SW
- 2585 Barnstone Ave SW Unit 2585
- 2644 Delaware Ave SW
- 4477 Shermont Ave SW
- 5271 Dolores St SW
- 5000 Mildred Cir SW
- 2391 Libra Cir SW
- 2580 Swiss Ave SW
- 5180 Lynncrest St SW
- 4311 Pioneer Cir SW
- 7000 Navarre Rd SW
- 3650 Fall Ave SW
- 3690 Fall Ave SW
- 5550 Autumncrest St SW
- 3712 Fall Ave SW
- 5590 Winterdale St SW
- 3651 Fall Ave SW
- 5600 Autumncrest St SW
- 5567 Faircrest St SW
- 5547 Faircrest St SW
- 5549 Autumncrest St SW
- 3616 Leonard Ave SW
- 5571 Autumncrest St SW
- 5601 Faircrest St SW
- 5595 Autumncrest St SW
- 5617 Faircrest St SW
- 3584 Leonard Ave SW
- 5615 Autumncrest St SW
- 5646 Winterdale St SW
- 5655 Winterdale St SW
- 5475 Faircrest St SW
Your Personal Tour Guide
Ask me questions while you tour the home.