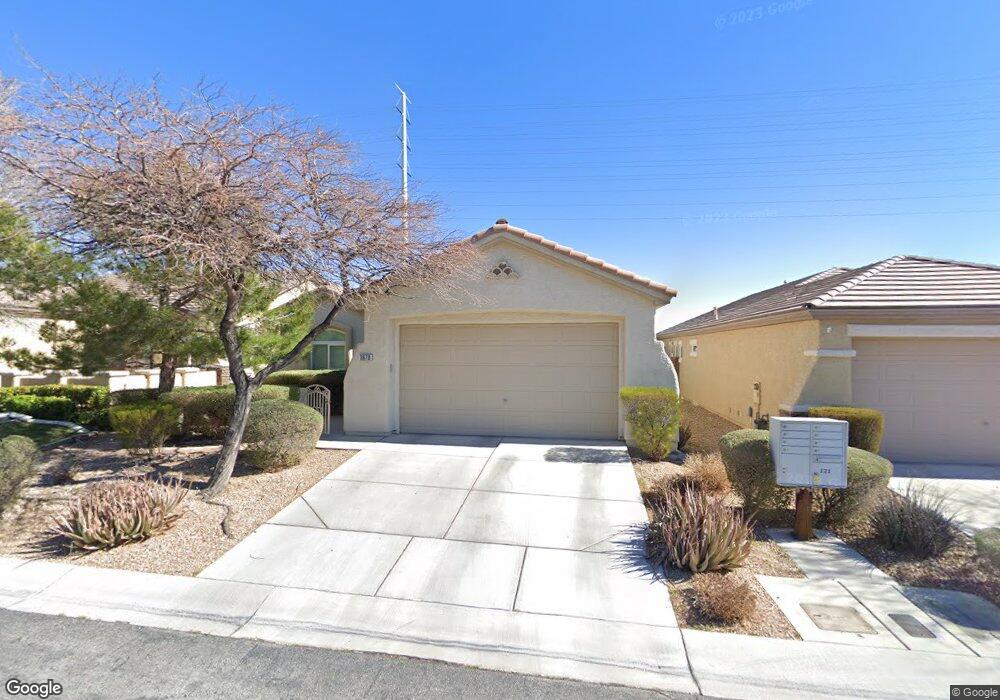
3670 Moonlit Rain Dr Las Vegas, NV 89135
Summerlin NeighborhoodEstimated Value: $598,000 - $658,000
3
Beds
2
Baths
1,885
Sq Ft
$333/Sq Ft
Est. Value
About This Home
This home is located at 3670 Moonlit Rain Dr, Las Vegas, NV 89135 and is currently estimated at $627,044, approximately $332 per square foot. 3670 Moonlit Rain Dr is a home located in Clark County with nearby schools including Judy & John L. Goolsby Elementary School, Victoria Fertitta Middle School, and Durango High School.
Ownership History
Date
Name
Owned For
Owner Type
Purchase Details
Closed on
Mar 22, 2017
Sold by
Dorais Mary
Bought by
Bolodman Curtis and Courtright Kayla
Current Estimated Value
Home Financials for this Owner
Home Financials are based on the most recent Mortgage that was taken out on this home.
Original Mortgage
$342,500
Outstanding Balance
$284,019
Interest Rate
4.17%
Mortgage Type
VA
Estimated Equity
$343,025
Purchase Details
Closed on
Jan 8, 2016
Sold by
Dorais Mary
Bought by
Dorais Francis and Brocksom Dorothea
Purchase Details
Closed on
Oct 11, 2013
Sold by
Pike Melvin L
Bought by
Pike Melvin L
Purchase Details
Closed on
Sep 28, 2011
Sold by
Pike Melvin L
Bought by
Pike Judith
Purchase Details
Closed on
May 21, 2002
Sold by
Pn Ii Inc
Bought by
Pike Melvin L
Home Financials for this Owner
Home Financials are based on the most recent Mortgage that was taken out on this home.
Original Mortgage
$199,264
Interest Rate
6.94%
Create a Home Valuation Report for This Property
The Home Valuation Report is an in-depth analysis detailing your home's value as well as a comparison with similar homes in the area
Home Values in the Area
Average Home Value in this Area
Purchase History
| Date | Buyer | Sale Price | Title Company |
|---|---|---|---|
| Bolodman Curtis | $342,500 | Chicago Title Of Nevada | |
| Dorais Francis | -- | None Available | |
| Pike Melvin L | -- | None Available | |
| Pike Judith | -- | None Available | |
| Pike Melvin L | -- | None Available | |
| Pike Melvin L | $214,478 | Lawyers Title |
Source: Public Records
Mortgage History
| Date | Status | Borrower | Loan Amount |
|---|---|---|---|
| Open | Bolodman Curtis | $342,500 | |
| Previous Owner | Pike Melvin L | $199,264 |
Source: Public Records
Tax History Compared to Growth
Tax History
| Year | Tax Paid | Tax Assessment Tax Assessment Total Assessment is a certain percentage of the fair market value that is determined by local assessors to be the total taxable value of land and additions on the property. | Land | Improvement |
|---|---|---|---|---|
| 2025 | $2,775 | $154,221 | $64,400 | $89,821 |
| 2024 | $2,483 | $154,221 | $64,400 | $89,821 |
| 2023 | $2,338 | $130,092 | $45,500 | $84,592 |
| 2022 | $2,105 | $114,680 | $37,100 | $77,580 |
| 2021 | $2,470 | $106,908 | $33,250 | $73,658 |
| 2020 | $2,620 | $106,286 | $33,250 | $73,036 |
| 2019 | $2,133 | $101,627 | $29,750 | $71,877 |
| 2018 | $2,110 | $93,850 | $24,500 | $69,350 |
| 2017 | $2,719 | $92,321 | $22,400 | $69,921 |
| 2016 | $2,338 | $87,893 | $18,200 | $69,693 |
| 2015 | $2,333 | $83,817 | $15,050 | $68,767 |
| 2014 | $2,265 | $77,314 | $11,200 | $66,114 |
Source: Public Records
Map
Nearby Homes
- 10922 Moonbeam Glow Ln
- 10982 Village Ridge Ln
- 3744 Fading Sun St
- 10809 Garden Mist Dr Unit 2105
- 10809 Garden Mist Dr Unit 1077
- 11053 Zarod Rd
- 10799 Flame Vine Ct
- 11 Hawkeye Ln
- 11138 Twilight Times Ct
- 5 Moonfire Dr
- 20 Garden Rain Dr
- 4122 Yucca Bloom St
- 4126 Yucca Bloom St
- 4140 Coneflower St
- 10717 Refectory Ave
- 3257 Rushing Waters Place
- 10555 Garden Rose Dr
- 3236 Rushing Waters Place
- 3215 Orange Sun St
- 4174 Salisto St
- 3664 Moonlit Rain Dr
- 3682 Moonlit Rain Dr
- 3658 Moonlit Rain Dr
- 3658 Moonlit Rain Dr Unit n/a
- 10934 Village Ridge Ln
- 3652 Moonlit Rain Dr Unit 1
- 3688 Moonlit Rain Dr
- 3644 Moonlit Rain Dr
- 3694 Moonlit Rain Dr
- 10917 Village Ridge Ln
- 10950 Village Ridge Ln
- 10935 Village Ridge Ln Unit 1
- 3640 Moonlit Rain Dr
- 3698 Moonlit Rain Dr
- 3645 Moonlit Rain Dr Unit 1
- 10966 Village Ridge Ln Unit 1
- 10949 Village Ridge Ln
- 10949 Village Ridge Ln
- 3636 Moonlit Rain Dr Unit 1
- 3704 Moonlit Rain Dr Unit 2