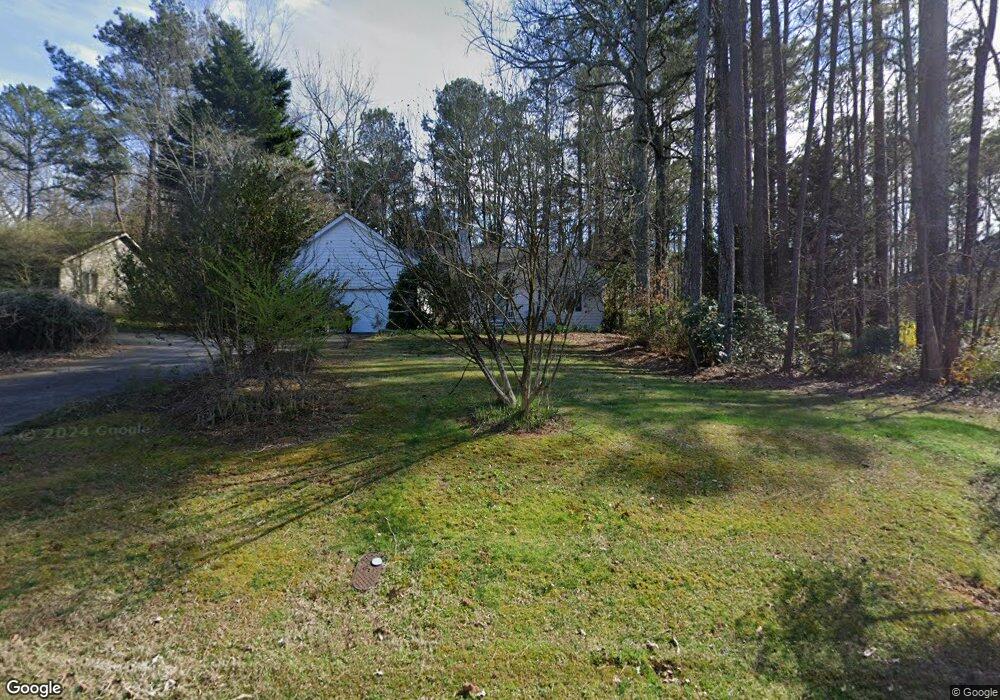
3670 T W Henderson Rd Cumming, GA 30041
Lake Lanier NeighborhoodEstimated Value: $399,440 - $511,000
3
Beds
2
Baths
1,669
Sq Ft
$268/Sq Ft
Est. Value
About This Home
This home is located at 3670 T W Henderson Rd, Cumming, GA 30041 and is currently estimated at $447,610, approximately $268 per square foot. 3670 T W Henderson Rd is a home located in Forsyth County with nearby schools including Chattahoochee Elementary School, Little Mill Middle School, and Cornerstone Schools.
Ownership History
Date
Name
Owned For
Owner Type
Purchase Details
Closed on
Dec 26, 2001
Sold by
Castiglia Russell J
Bought by
Castiglia Russell J and Castiglia Deborah
Current Estimated Value
Home Financials for this Owner
Home Financials are based on the most recent Mortgage that was taken out on this home.
Original Mortgage
$148,000
Interest Rate
6.85%
Mortgage Type
New Conventional
Purchase Details
Closed on
Aug 22, 1997
Sold by
Wiggins Betty Jean
Bought by
Castiglia Russell John and Castiglia Deborah R
Home Financials for this Owner
Home Financials are based on the most recent Mortgage that was taken out on this home.
Original Mortgage
$117,280
Interest Rate
7.43%
Mortgage Type
New Conventional
Purchase Details
Closed on
Mar 26, 1993
Sold by
Temonti Building Inc
Bought by
Wiggins Betty Jean
Home Financials for this Owner
Home Financials are based on the most recent Mortgage that was taken out on this home.
Original Mortgage
$80,000
Interest Rate
7.8%
Create a Home Valuation Report for This Property
The Home Valuation Report is an in-depth analysis detailing your home's value as well as a comparison with similar homes in the area
Home Values in the Area
Average Home Value in this Area
Purchase History
| Date | Buyer | Sale Price | Title Company |
|---|---|---|---|
| Castiglia Russell J | -- | -- | |
| Castiglia Russell John | $119,000 | -- | |
| Wiggins Betty Jean | $85,000 | -- |
Source: Public Records
Mortgage History
| Date | Status | Borrower | Loan Amount |
|---|---|---|---|
| Closed | Castiglia Russell J | $148,000 | |
| Previous Owner | Castiglia Russell John | $117,280 | |
| Previous Owner | Wiggins Betty Jean | $80,000 |
Source: Public Records
Tax History Compared to Growth
Tax History
| Year | Tax Paid | Tax Assessment Tax Assessment Total Assessment is a certain percentage of the fair market value that is determined by local assessors to be the total taxable value of land and additions on the property. | Land | Improvement |
|---|---|---|---|---|
| 2025 | $349 | $147,012 | $50,000 | $97,012 |
| 2024 | $349 | $140,452 | $46,000 | $94,452 |
| 2023 | $268 | $151,204 | $40,000 | $111,204 |
| 2022 | $352 | $87,884 | $24,000 | $63,884 |
| 2021 | $335 | $87,884 | $24,000 | $63,884 |
| 2020 | $331 | $84,388 | $24,000 | $60,388 |
| 2019 | $332 | $81,812 | $16,000 | $65,812 |
| 2018 | $324 | $63,356 | $16,000 | $47,356 |
| 2017 | $1,471 | $59,864 | $16,000 | $43,864 |
| 2016 | $1,471 | $59,864 | $16,000 | $43,864 |
| 2015 | $1,389 | $55,864 | $12,000 | $43,864 |
| 2014 | $1,242 | $52,252 | $12,000 | $40,252 |
Source: Public Records
Map
Nearby Homes
- 3520 Hope Rd
- 3630 Hope Rd
- 3840 Pilgrim Mill Rd
- 3970 Bridgeman Cir
- 4190 Heather Way
- 4290 Bobbins Way
- 2955 Pilgrim Mill Rd
- 3445 Strawberry Ln
- 4050 Vintage Ct
- 4180 Etcetera Ln
- 4625 Greyson Manor Dr
- 4615 Greyson Manor Dr
- 2860 Pilgrim Mill Rd
- 4545 Greyson Manor Dr
- 4510 Aiden Way
- 4710 Chevy St
- 4045 Merritt Dr
- 3680 T W Henderson Rd
- 3660 T W Henderson Rd
- T T W Henderson Rd
- 3690 T W Henderson Rd
- 3650 T W Henderson Rd
- 3625 T W Henderson Rd
- 3655 T W Henderson Rd
- 3665 T W Henderson Rd
- 3730 T W Henderson Rd
- 3700 T W Henderson Rd
- 3645 T W Henderson Rd
- 0 Tw Henderson Unit 7632383
- 0 Tw Henderson Unit 7469889
- 3755 Tamiami Trail
- 3705 T W Henderson Rd
- 3715 T W Henderson Rd
- 3627 T W Henderson Rd
- 3725 T W Henderson Rd
- 3775 Tamiami Trail
- 3555 Pilgrim Mill Rd