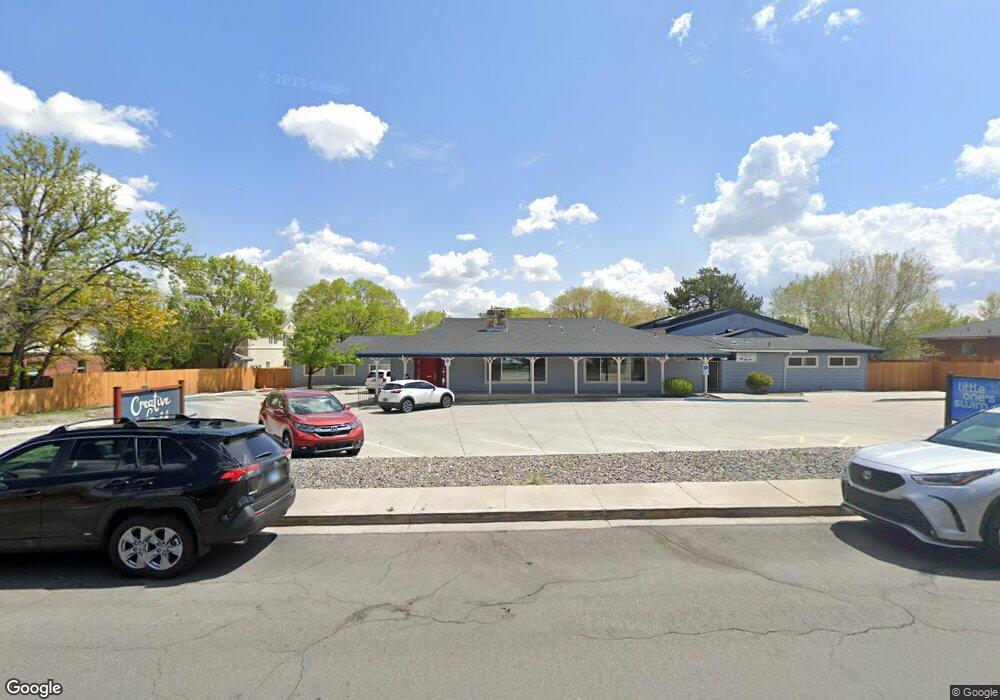
3670 Warren Way Reno, NV 89509
The Grove NeighborhoodEstimated Value: $2,125,199
2
Beds
3
Baths
3,450
Sq Ft
$616/Sq Ft
Est. Value
About This Home
This home is located at 3670 Warren Way, Reno, NV 89509 and is currently estimated at $2,125,199, approximately $615 per square foot. 3670 Warren Way is a home located in Washoe County with nearby schools including Huffaker Elementary School, Edward L Pine Middle School, and Reno High School.
Ownership History
Date
Name
Owned For
Owner Type
Purchase Details
Closed on
Mar 11, 2016
Sold by
Powers John and Heath Power Susan
Bought by
Lblc Llc
Current Estimated Value
Purchase Details
Closed on
Jan 25, 2007
Sold by
Lblc Llc
Bought by
Powers John and Heath Powers Susan
Purchase Details
Closed on
Apr 5, 2004
Sold by
Ballantyne Robin
Bought by
Lblc Llc
Home Financials for this Owner
Home Financials are based on the most recent Mortgage that was taken out on this home.
Original Mortgage
$500,000
Interest Rate
5.57%
Mortgage Type
Commercial
Purchase Details
Closed on
Jun 16, 1997
Sold by
Ballantyne Robin
Bought by
Ballantyne Robin and The Robin Ballantyne Family Trust
Purchase Details
Closed on
Mar 31, 1997
Sold by
Luce Delpha Cherry
Bought by
Ballantyne Robin S
Create a Home Valuation Report for This Property
The Home Valuation Report is an in-depth analysis detailing your home's value as well as a comparison with similar homes in the area
Home Values in the Area
Average Home Value in this Area
Purchase History
| Date | Buyer | Sale Price | Title Company |
|---|---|---|---|
| Lblc Llc | -- | First Centennial Reno | |
| Powers John | -- | None Available | |
| Lblc Llc | $900,000 | First Centennial Title Co | |
| Ballantyne Robin | -- | -- | |
| Ballantyne Robin S | $330,000 | Stewart Title Company |
Source: Public Records
Mortgage History
| Date | Status | Borrower | Loan Amount |
|---|---|---|---|
| Previous Owner | Lblc Llc | $500,000 | |
| Closed | Lblc Llc | $144,561 |
Source: Public Records
Tax History Compared to Growth
Tax History
| Year | Tax Paid | Tax Assessment Tax Assessment Total Assessment is a certain percentage of the fair market value that is determined by local assessors to be the total taxable value of land and additions on the property. | Land | Improvement |
|---|---|---|---|---|
| 2026 | $3,991 | $367,042 | $246,223 | $120,819 |
| 2025 | $7,431 | $359,721 | $238,981 | $120,740 |
| 2024 | $7,431 | $352,742 | $231,739 | $121,003 |
| 2023 | $6,884 | $315,360 | $202,772 | $112,588 |
| 2022 | $6,344 | $266,025 | $173,804 | $92,221 |
| 2021 | $5,877 | $234,276 | $144,837 | $89,439 |
| 2020 | $5,534 | $235,512 | $144,837 | $90,675 |
| 2019 | $5,267 | $232,343 | $144,837 | $87,506 |
| 2018 | $5,027 | $214,749 | $130,353 | $84,396 |
| 2017 | $4,718 | $194,112 | $115,870 | $78,242 |
| 2016 | $4,589 | $204,758 | $126,733 | $78,025 |
| 2015 | $1,231 | $123,900 | $106,722 | $17,178 |
| 2014 | $4,569 | $123,748 | $106,722 | $17,026 |
| 2013 | -- | $123,507 | $106,722 | $16,785 |
Source: Public Records
Map
Nearby Homes
- 3826 Lakeside Dr Unit 14
- 501 W Moana Ln Unit 52
- 501 W Moana Ln Unit 15
- 501 W Moana Ln Unit 59
- 630 Sapphire Cir
- 0 Lakeside Dr Unit 250053191
- 0 Lakeside Dr Unit 250001142
- 0 Lakeside Dr Unit 2 250051852
- 4003 Bluegrass Ct Unit A
- 4022 Millbrook Ln
- 4009 Ruth Ct
- 3301 Smith Dr
- 4004 Ruth Ct
- 4185 Baker Ln
- 4233 Baker Ln
- 3095 Lakeside Dr Unit 110
- 3095 Lakeside Dr Unit 102
- 3095 Lakeside Dr Unit 106
- 1160 Yates Ln
- 4314 Clyde Ct
- 540 Warren Ct
- 3650 Warren Way
- 510 Warren Ct
- 3690 Warren Way
- 500 Warren Ct
- 3681 Warren Way
- 3681 Warren Way Unit C
- 3681 Warren Way Unit B
- 3681 Warren Way Unit A
- 3669 Grant Dr
- 535 Warren Ct
- 555 Warren Ct
- 575 Warren Ct
- 515 Warren Ct
- 595 Warren Ct
- 3685 Warren Way
- 501 Warren Ct
- 3679 Grant Dr
- 3667 Grant Dr
- 775 Sarcinella Ct