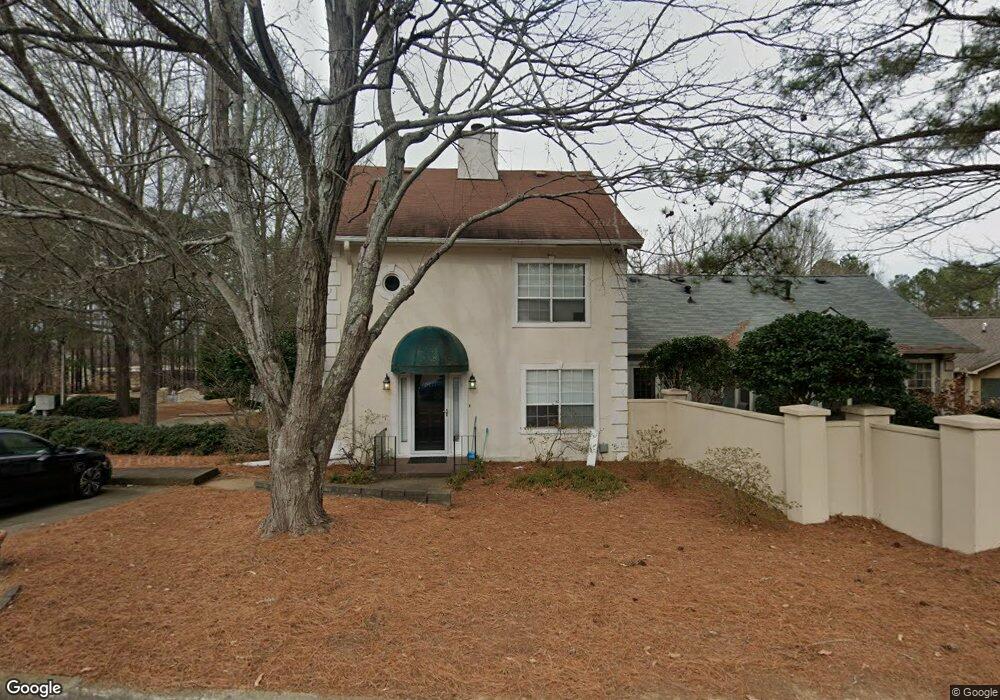
3671 Raven Way Unit 2 Duluth, GA 30096
Estimated Value: $295,000 - $309,000
2
Beds
3
Baths
1,536
Sq Ft
$198/Sq Ft
Est. Value
About This Home
This home is located at 3671 Raven Way Unit 2, Duluth, GA 30096 and is currently estimated at $303,588, approximately $197 per square foot. 3671 Raven Way Unit 2 is a home located in Gwinnett County with nearby schools including Chattahoochee Elementary School, Coleman Middle School, and Duluth High School.
Ownership History
Date
Name
Owned For
Owner Type
Purchase Details
Closed on
Dec 31, 2015
Sold by
Windermere Enterprises Llc
Bought by
Bai Jun Ei
Current Estimated Value
Home Financials for this Owner
Home Financials are based on the most recent Mortgage that was taken out on this home.
Original Mortgage
$87,850
Outstanding Balance
$70,339
Interest Rate
3.96%
Mortgage Type
New Conventional
Estimated Equity
$233,249
Purchase Details
Closed on
Jul 7, 2015
Sold by
Miller Kimberly R
Bought by
Windermere Enterprises Llc
Purchase Details
Closed on
Feb 22, 2002
Sold by
Horowitz Jack A and Horowitz Deanie A
Bought by
Miller Kimberly R
Home Financials for this Owner
Home Financials are based on the most recent Mortgage that was taken out on this home.
Original Mortgage
$128,727
Interest Rate
7.02%
Mortgage Type
FHA
Purchase Details
Closed on
May 30, 2001
Sold by
Temple Inland Mtg Corp
Bought by
Horowitz Charles and Horowitz Kimie
Create a Home Valuation Report for This Property
The Home Valuation Report is an in-depth analysis detailing your home's value as well as a comparison with similar homes in the area
Home Values in the Area
Average Home Value in this Area
Purchase History
| Date | Buyer | Sale Price | Title Company |
|---|---|---|---|
| Bai Jun Ei | $127,000 | -- | |
| Windermere Enterprises Llc | $87,000 | -- | |
| Miller Kimberly R | $133,500 | -- | |
| Horowitz Charles | -- | -- |
Source: Public Records
Mortgage History
| Date | Status | Borrower | Loan Amount |
|---|---|---|---|
| Open | Bai Jun Ei | $87,850 | |
| Previous Owner | Miller Kimberly R | $128,727 |
Source: Public Records
Tax History Compared to Growth
Tax History
| Year | Tax Paid | Tax Assessment Tax Assessment Total Assessment is a certain percentage of the fair market value that is determined by local assessors to be the total taxable value of land and additions on the property. | Land | Improvement |
|---|---|---|---|---|
| 2025 | $836 | $120,680 | $18,040 | $102,640 |
| 2024 | $3,643 | $113,840 | $20,000 | $93,840 |
| 2023 | $3,643 | $110,960 | $20,000 | $90,960 |
| 2022 | $3,310 | $103,120 | $18,000 | $85,120 |
| 2021 | $2,523 | $76,920 | $12,800 | $64,120 |
| 2020 | $2,439 | $73,800 | $12,800 | $61,000 |
| 2019 | $2,947 | $73,800 | $12,800 | $61,000 |
| 2018 | $2,134 | $64,440 | $12,800 | $51,640 |
| 2016 | $1,680 | $50,800 | $10,000 | $40,800 |
| 2015 | $1,483 | $42,280 | $10,000 | $32,280 |
| 2014 | -- | $42,280 | $10,000 | $32,280 |
Source: Public Records
Map
Nearby Homes
- 3677 Blackshear Ct
- 3620 Darwin Place
- 3707 Meeting St
- 3646 Gray Place
- 3659 E Bay St
- 3745 Meeting St
- 3629 E Bay St
- 3543 Benthollow Way
- 3929 Meeting St
- 3923 Meeting St
- 3781 Meeting St Unit 4
- 3793 Meeting St NW
- 3835 Meeting St
- 3555 Grovecrest Way Unit 5
- 3544 Willgrove Way
- 3543 Willgrove Way Unit 1
- 3485 Parkbrooke Ln
- 3622 S Whippoorwill Dr
- 3742 Berkeley Crossing
- 3673 Raven Way
- 3673 Raven Way Unit 3673
- 0 Sidney Lanier Blvd Unit 8667586
- 0 Sidney Lanier Blvd Unit 7350190
- 0 Sidney Lanier Blvd Unit 7301393
- 0 Sidney Lanier Blvd Unit 8116523
- 0 Sidney Lanier Blvd Unit 7449030
- 0 Sidney Lanier Blvd Unit 8569359
- 0 Sidney Lanier Blvd Unit 8539696
- 0 Sidney Lanier Blvd Unit 8284184
- 0 Sidney Lanier Blvd Unit 8292145
- 0 Sidney Lanier Blvd Unit 7234219
- 0 Sidney Lanier Blvd Unit 8831188
- 0 Sidney Lanier Blvd Unit 8941571
- 0 Sidney Lanier Blvd Unit 7193032
- 0 Sidney Lanier Blvd Unit 7488407
- 0 Sidney Lanier Blvd Unit 7493876
- 0 Sidney Lanier Blvd
- 3678 Blackshear Ct
- 3693 Raven Way