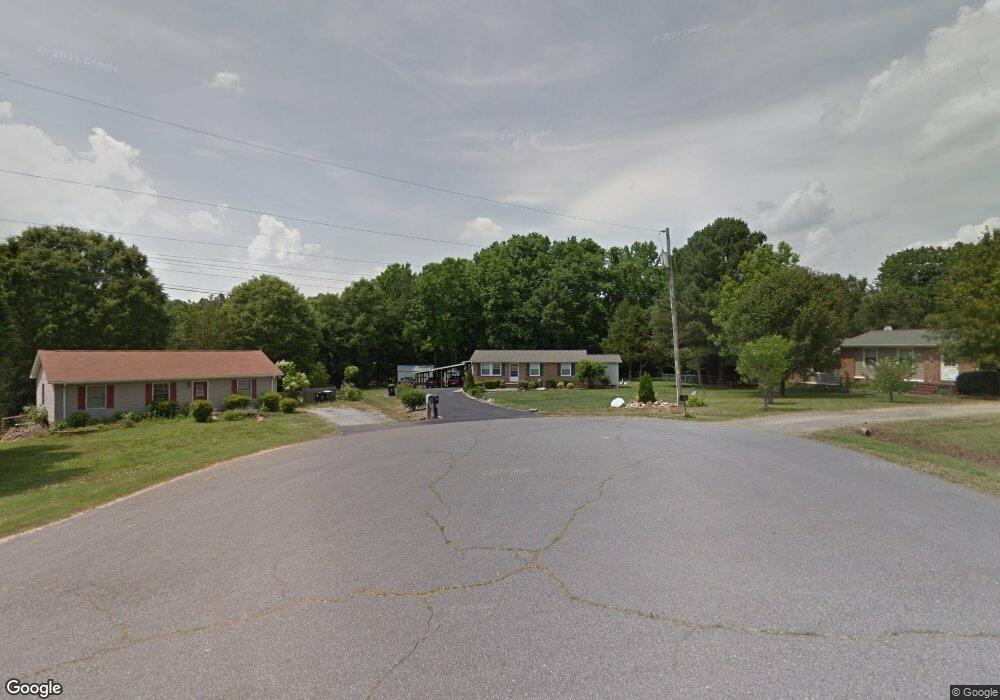
3672 Fieldcrest Cir NW Concord, NC 28027
Estimated Value: $188,000 - $261,000
3
Beds
2
Baths
1,056
Sq Ft
$223/Sq Ft
Est. Value
About This Home
This home is located at 3672 Fieldcrest Cir NW, Concord, NC 28027 and is currently estimated at $235,413, approximately $222 per square foot. 3672 Fieldcrest Cir NW is a home located in Cabarrus County with nearby schools including Weddington Hills Elementary School, Harold E. Winkler Middle School, and Cabarrus Charter Academy.
Ownership History
Date
Name
Owned For
Owner Type
Purchase Details
Closed on
Jan 13, 2024
Sold by
Stepanian Patricia M Long
Bought by
Mann Elizabeth and Mann Clayton
Current Estimated Value
Home Financials for this Owner
Home Financials are based on the most recent Mortgage that was taken out on this home.
Original Mortgage
$164,835
Outstanding Balance
$163,359
Interest Rate
6.61%
Mortgage Type
FHA
Estimated Equity
$72,054
Purchase Details
Closed on
Sep 13, 2000
Sold by
Long Patricia M and Long Robert G
Bought by
Stepanian Robert G and Stepanian Patricia M
Home Financials for this Owner
Home Financials are based on the most recent Mortgage that was taken out on this home.
Original Mortgage
$60,000
Interest Rate
8.17%
Purchase Details
Closed on
Mar 1, 1982
Create a Home Valuation Report for This Property
The Home Valuation Report is an in-depth analysis detailing your home's value as well as a comparison with similar homes in the area
Home Values in the Area
Average Home Value in this Area
Purchase History
| Date | Buyer | Sale Price | Title Company |
|---|---|---|---|
| Mann Elizabeth | $170,000 | Magnolia Title Company | |
| Stepanian Robert G | -- | -- | |
| -- | $36,000 | -- |
Source: Public Records
Mortgage History
| Date | Status | Borrower | Loan Amount |
|---|---|---|---|
| Open | Mann Elizabeth | $164,835 | |
| Previous Owner | Stepanian Robert G | $60,000 |
Source: Public Records
Tax History Compared to Growth
Tax History
| Year | Tax Paid | Tax Assessment Tax Assessment Total Assessment is a certain percentage of the fair market value that is determined by local assessors to be the total taxable value of land and additions on the property. | Land | Improvement |
|---|---|---|---|---|
| 2025 | $2,419 | $242,920 | $45,000 | $197,920 |
| 2024 | $2,419 | $242,920 | $45,000 | $197,920 |
| 2023 | $931 | $152,590 | $38,000 | $114,590 |
| 2022 | $861 | $141,170 | $38,000 | $103,170 |
| 2021 | $861 | $141,170 | $38,000 | $103,170 |
| 2020 | $1,722 | $141,170 | $38,000 | $103,170 |
| 2019 | $1,141 | $93,520 | $22,000 | $71,520 |
| 2018 | $1,122 | $93,520 | $22,000 | $71,520 |
| 2017 | $1,104 | $93,520 | $22,000 | $71,520 |
| 2016 | $655 | $94,360 | $22,000 | $72,360 |
| 2015 | $1,113 | $94,360 | $22,000 | $72,360 |
| 2014 | $1,113 | $94,360 | $22,000 | $72,360 |
Source: Public Records
Map
Nearby Homes
- 3724 Patricia Dr NW
- 3575 Travis Ln NW
- 234 Candle Ct NW
- 3793 Lake Spring Ave NW
- 458 Allen Dr NW
- 456 Allen Dr NW
- 490 Cavehill Dr NW
- 1252 Giverny Ct NW
- 1246 Greenside Dr NW
- 2652 Bedford Place NW
- 2635 Danbury Circle Dr NW
- 533 Montgrove Place NW
- 2695 Jameson Dr NW
- 3275 Vista Place NW
- 2676 Sunberry Ln NW
- 376 Brookgreen Place NW
- 178 Fulworth Dr Unit 64
- 2971 Alveston Dr Unit 29
- 518 Wellbourne Ct NW
- 2817 Westfield Ave NW
- 3702 Fieldcrest Cir NW
- 3668 Fieldcrest Cir NW
- 3706 Fieldcrest Cir NW
- 3715 Patricia Dr NW
- 3664 Fieldcrest Cir NW
- 3717 Patricia Dr NW
- 3710 Fieldcrest Cir NW
- 3721 Patricia Dr NW
- 3705 Fieldcrest Cir NW
- 3713 Patricia Dr NW
- 3714 Fieldcrest Cir NW
- 3709 Fieldcrest Cir NW
- 3611 Patricia Dr NW
- 3615 Patricia Dr NW
- 3707 Patricia Dr NW
- 612 Primrose Ln NW
- 3607 Patricia Dr NW
- 3659 Fieldcrest Cir NW
- 606 Primrose Ln NW
- 3653 Patricia Dr NW