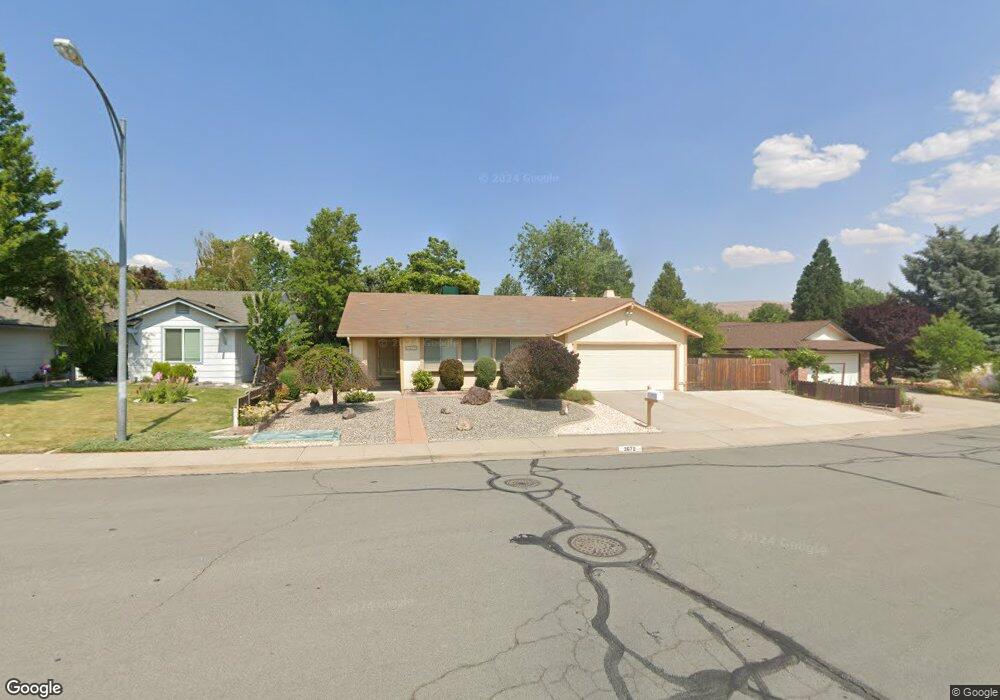
3672 Longridge Dr Sparks, NV 89434
Reed NeighborhoodEstimated Value: $494,000 - $528,000
4
Beds
2
Baths
1,888
Sq Ft
$267/Sq Ft
Est. Value
About This Home
This home is located at 3672 Longridge Dr, Sparks, NV 89434 and is currently estimated at $504,487, approximately $267 per square foot. 3672 Longridge Dr is a home located in Washoe County with nearby schools including Hershal H. Beam Elementary School, Jerry Whitehead Elementary School, and Lou Mendive Middle School.
Ownership History
Date
Name
Owned For
Owner Type
Purchase Details
Closed on
Dec 6, 2006
Sold by
Garrison Laurence A and Garrison Virginia C
Bought by
Garrison Laurence A and Garrison Virginia C
Current Estimated Value
Home Financials for this Owner
Home Financials are based on the most recent Mortgage that was taken out on this home.
Original Mortgage
$235,000
Interest Rate
6.38%
Mortgage Type
New Conventional
Purchase Details
Closed on
Oct 25, 1996
Sold by
Garrison Laurence A and Garrison Virginia C
Bought by
Garrison Laurence A and Garrison Virginia C
Home Financials for this Owner
Home Financials are based on the most recent Mortgage that was taken out on this home.
Original Mortgage
$25,900
Interest Rate
8.11%
Purchase Details
Closed on
Aug 13, 1996
Sold by
Garrison Laurence A and Garrison Virginia C
Bought by
Garrison Laurence A and Garrison Virginia C
Create a Home Valuation Report for This Property
The Home Valuation Report is an in-depth analysis detailing your home's value as well as a comparison with similar homes in the area
Home Values in the Area
Average Home Value in this Area
Purchase History
| Date | Buyer | Sale Price | Title Company |
|---|---|---|---|
| Garrison Laurence A | -- | First American Title | |
| Garrison Laurence A | -- | First American Title Co | |
| Garrison Laurence A | -- | First American Title Co | |
| Garrison Laurence A | -- | -- |
Source: Public Records
Mortgage History
| Date | Status | Borrower | Loan Amount |
|---|---|---|---|
| Closed | Garrison Laurence A | $235,000 | |
| Closed | Garrison Laurence A | $25,900 |
Source: Public Records
Tax History Compared to Growth
Tax History
| Year | Tax Paid | Tax Assessment Tax Assessment Total Assessment is a certain percentage of the fair market value that is determined by local assessors to be the total taxable value of land and additions on the property. | Land | Improvement |
|---|---|---|---|---|
| 2026 | $1,601 | $78,408 | $36,890 | $41,518 |
| 2025 | $2,088 | $79,106 | $36,120 | $42,986 |
| 2024 | $2,088 | $77,211 | $33,215 | $43,996 |
| 2023 | $2,026 | $77,406 | $35,175 | $42,231 |
| 2022 | $1,967 | $62,428 | $26,740 | $35,688 |
| 2021 | $1,911 | $57,714 | $21,735 | $35,979 |
| 2020 | $1,855 | $57,221 | $20,720 | $36,501 |
| 2019 | $1,800 | $56,413 | $20,720 | $35,693 |
| 2018 | $1,745 | $49,779 | $14,455 | $35,324 |
| 2017 | $1,697 | $49,477 | $13,720 | $35,757 |
| 2016 | $1,654 | $48,996 | $12,250 | $36,746 |
| 2015 | $1,651 | $47,631 | $10,325 | $37,306 |
| 2014 | $1,604 | $45,245 | $9,030 | $36,215 |
| 2013 | -- | $42,651 | $6,860 | $35,791 |
Source: Public Records
Map
Nearby Homes
- 3345 Groom Way
- 1557 Satellite Dr
- 3253 Clan Alpine Dr
- 1472 Giannotti Dr
- 3127 Montezuma Way
- Plan 4 at Eagle Peak
- Plan 5 at Eagle Peak
- Plan 2 at Eagle Peak
- Plan 1 at Eagle Peak
- Plan 3 at Eagle Peak
- 3222 Myles Dr
- 4393 Acobat Ct
- 3988 Ella Jayne Ct Unit Lot 6
- 3602 Oakridge Dr
- 1031 Vintage Hills Pkwy
- 1790 Desert Mountain Dr
- 1792 Braidwood Dr
- 1069 Palmwood Dr
- 4434 Whitney Cir
- 1675 Round Mountain Cir
- 3702 Longridge Dr Unit 2
- 3652 Longridge Dr
- 3647 Hillsdale Ct
- 3657 Hillsdale Ct
- 3732 Longridge Dr
- 3632 Longridge Dr
- 3637 Hillsdale Ct
- 3674 Willowdale Dr
- 3667 Hillsdale Ct
- 3651 Longridge Dr
- 3752 Longridge Dr
- 3664 Willowdale Dr
- 3622 Longridge Dr
- 3631 Longridge Dr
- 3741 Longridge Dr
- 3677 Hillsdale Ct
- 3621 Longridge Dr
- 1455 Winterwood Ave
- 3644 Willowdale Dr
- 3772 Longridge Dr