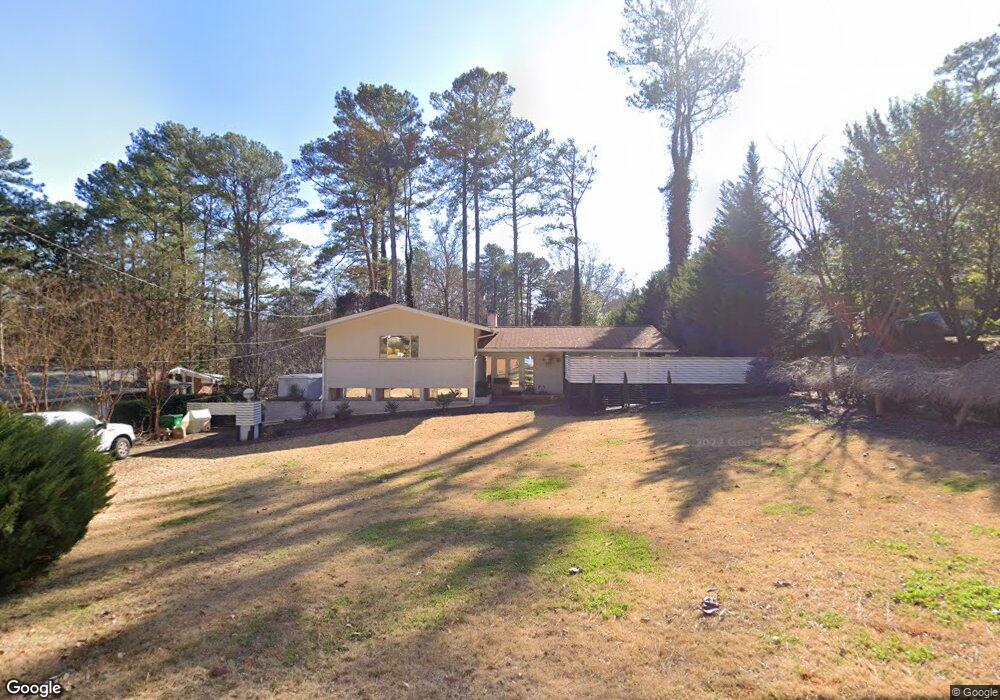
3673 Creekview Cir Stone Mountain, GA 30083
Estimated Value: $326,129 - $360,000
3
Beds
2
Baths
2,313
Sq Ft
$151/Sq Ft
Est. Value
About This Home
This home is located at 3673 Creekview Cir, Stone Mountain, GA 30083 and is currently estimated at $349,282, approximately $151 per square foot. 3673 Creekview Cir is a home located in DeKalb County with nearby schools including Dunaire Elementary School, Freedom Middle School, and Clarkston High School.
Ownership History
Date
Name
Owned For
Owner Type
Purchase Details
Closed on
Sep 13, 2011
Sold by
Federal National Mortgage Association
Bought by
Weston Donald
Current Estimated Value
Purchase Details
Closed on
Jun 13, 2007
Sold by
Lopez Manuel
Bought by
Coronado Miguel M
Home Financials for this Owner
Home Financials are based on the most recent Mortgage that was taken out on this home.
Original Mortgage
$171,000
Interest Rate
6.1%
Mortgage Type
New Conventional
Purchase Details
Closed on
Apr 30, 2004
Sold by
Capers Jamdes M and Capers Barbara
Bought by
Lopez Manuel
Home Financials for this Owner
Home Financials are based on the most recent Mortgage that was taken out on this home.
Original Mortgage
$153,400
Interest Rate
5.36%
Mortgage Type
New Conventional
Purchase Details
Closed on
Feb 10, 1995
Sold by
Cusack M Madeline
Bought by
Capers James M
Create a Home Valuation Report for This Property
The Home Valuation Report is an in-depth analysis detailing your home's value as well as a comparison with similar homes in the area
Home Values in the Area
Average Home Value in this Area
Purchase History
| Date | Buyer | Sale Price | Title Company |
|---|---|---|---|
| Weston Donald | $54,900 | -- | |
| Coronado Miguel M | $171,000 | -- | |
| Lopez Manuel | $161,500 | -- | |
| Capers James M | $106,800 | -- |
Source: Public Records
Mortgage History
| Date | Status | Borrower | Loan Amount |
|---|---|---|---|
| Previous Owner | Coronado Miguel M | $171,000 | |
| Previous Owner | Lopez Manuel | $153,400 | |
| Closed | Capers James M | $0 |
Source: Public Records
Tax History Compared to Growth
Tax History
| Year | Tax Paid | Tax Assessment Tax Assessment Total Assessment is a certain percentage of the fair market value that is determined by local assessors to be the total taxable value of land and additions on the property. | Land | Improvement |
|---|---|---|---|---|
| 2025 | $2,945 | $116,720 | $20,000 | $96,720 |
| 2024 | $2,878 | $113,040 | $20,000 | $93,040 |
| 2023 | $2,878 | $110,880 | $20,000 | $90,880 |
| 2022 | $2,231 | $88,640 | $17,520 | $71,120 |
| 2021 | $1,625 | $62,360 | $17,520 | $44,840 |
| 2020 | $1,308 | $48,480 | $17,320 | $31,160 |
| 2019 | $1,503 | $57,080 | $17,320 | $39,760 |
| 2018 | $1,483 | $51,440 | $17,320 | $34,120 |
| 2017 | $1,419 | $52,600 | $17,320 | $35,280 |
| 2016 | $1,570 | $59,480 | $17,320 | $42,160 |
| 2014 | $1,094 | $38,320 | $17,320 | $21,000 |
Source: Public Records
Map
Nearby Homes
- 3532 Dial Dr
- 485 Lantern Wood Dr
- 3724 Chavers Place
- 3661 Lantern Crest Cove
- 508 Greenridge Cir
- 529 Lantern Wood Dr
- 538 Lantern Wood Dr
- 3728 Dial Dr
- 3389 Lantern View Ln
- 414 Ridge Creek Dr
- 786 Brookside Parc Ln
- 415 Ridge Creek Dr
- 481 Glendale Rd
- 503 Glendale Rd
- 539 Glendale Rd
- 417 Kensington Parc Way
- 3681 Creekview Cir
- 3665 Creekview Cir
- 3507 Creekview Cir
- 3515 Creekview Cir
- 3499 Creekview Cir
- 3657 Creekview Cir Unit 7
- 444 Creekview Dr
- 452 Creekview Dr Unit 4
- 3678 Creekview Cir
- 3670 Creekview Cir
- 3523 Creekview Cir
- 3662 Creekview Cir Unit 7
- 3686 Creekview Cir Unit VII
- 436 Creekview Dr Unit 4
- 3649 Creekview Cir
- 0 Creekview Cir Unit 7088977
- 0 Creekview Cir Unit 3270014
- 0 Creekview Cir Unit 8383809
- 0 Creekview Cir Unit 7497319
- 0 Creekview Cir