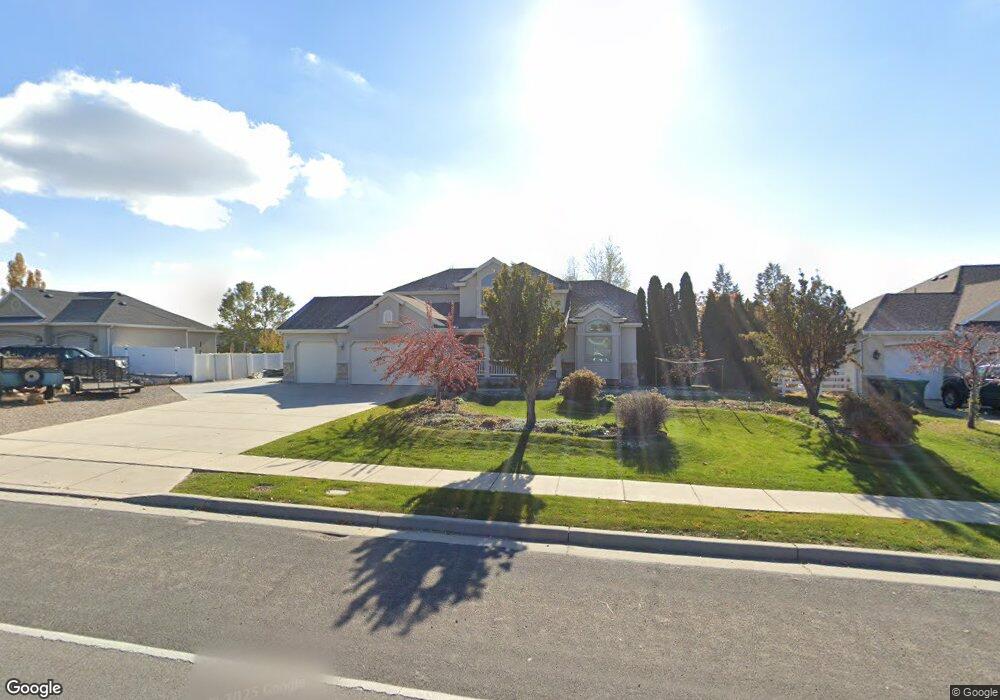
3673 W Gordon Ave Layton, UT 84041
Estimated Value: $647,000 - $773,000
4
Beds
3
Baths
3,901
Sq Ft
$183/Sq Ft
Est. Value
About This Home
This home is located at 3673 W Gordon Ave, Layton, UT 84041 and is currently estimated at $712,628, approximately $182 per square foot. 3673 W Gordon Ave is a home located in Davis County with nearby schools including Sand Springs Elementary School, Legacy Junior High School, and Layton High School.
Ownership History
Date
Name
Owned For
Owner Type
Purchase Details
Closed on
Mar 22, 2018
Sold by
Santos Sy E and Santos Tawnya S
Bought by
Santos Tawnya S and Santos Revocable Living Trust
Current Estimated Value
Purchase Details
Closed on
Apr 23, 2004
Sold by
Santos Sy E and Santos Tawna S
Bought by
Santos Sy E and Santos Tawnya S
Home Financials for this Owner
Home Financials are based on the most recent Mortgage that was taken out on this home.
Original Mortgage
$272,000
Interest Rate
5.35%
Mortgage Type
New Conventional
Purchase Details
Closed on
Jul 12, 2002
Sold by
Gmw Development Inc
Bought by
Santos Sy E and Santos Tawna S
Home Financials for this Owner
Home Financials are based on the most recent Mortgage that was taken out on this home.
Original Mortgage
$236,080
Interest Rate
6.69%
Create a Home Valuation Report for This Property
The Home Valuation Report is an in-depth analysis detailing your home's value as well as a comparison with similar homes in the area
Home Values in the Area
Average Home Value in this Area
Purchase History
| Date | Buyer | Sale Price | Title Company |
|---|---|---|---|
| Santos Tawnya S | -- | -- | |
| Santos Sy E | -- | Bonneville Title Company Inc | |
| Santos Sy E | -- | Bonneville Title Company Inc |
Source: Public Records
Mortgage History
| Date | Status | Borrower | Loan Amount |
|---|---|---|---|
| Previous Owner | Santos Sy E | $272,000 | |
| Previous Owner | Santos Sy E | $236,080 | |
| Closed | Santos Sy E | $44,265 |
Source: Public Records
Tax History Compared to Growth
Tax History
| Year | Tax Paid | Tax Assessment Tax Assessment Total Assessment is a certain percentage of the fair market value that is determined by local assessors to be the total taxable value of land and additions on the property. | Land | Improvement |
|---|---|---|---|---|
| 2025 | $3,521 | $369,600 | $152,906 | $216,694 |
| 2024 | $3,339 | $353,099 | $152,722 | $200,377 |
| 2023 | $3,267 | $334,950 | $127,732 | $207,217 |
| 2022 | $3,456 | $636,000 | $211,327 | $424,673 |
| 2021 | $3,127 | $472,000 | $174,182 | $297,818 |
| 2020 | $2,990 | $433,000 | $153,820 | $279,180 |
| 2019 | $2,912 | $413,000 | $140,039 | $272,961 |
| 2018 | $2,711 | $386,000 | $124,702 | $261,298 |
| 2016 | $2,432 | $178,640 | $58,434 | $120,206 |
| 2015 | $2,462 | $171,655 | $58,434 | $113,221 |
| 2014 | $2,116 | $150,897 | $58,434 | $92,463 |
| 2013 | -- | $171,383 | $49,029 | $122,354 |
Source: Public Records
Map
Nearby Homes