36739 Theta Ct Fremont, CA 94536
Cabrillo NeighborhoodEstimated Value: $1,323,000 - $1,477,000
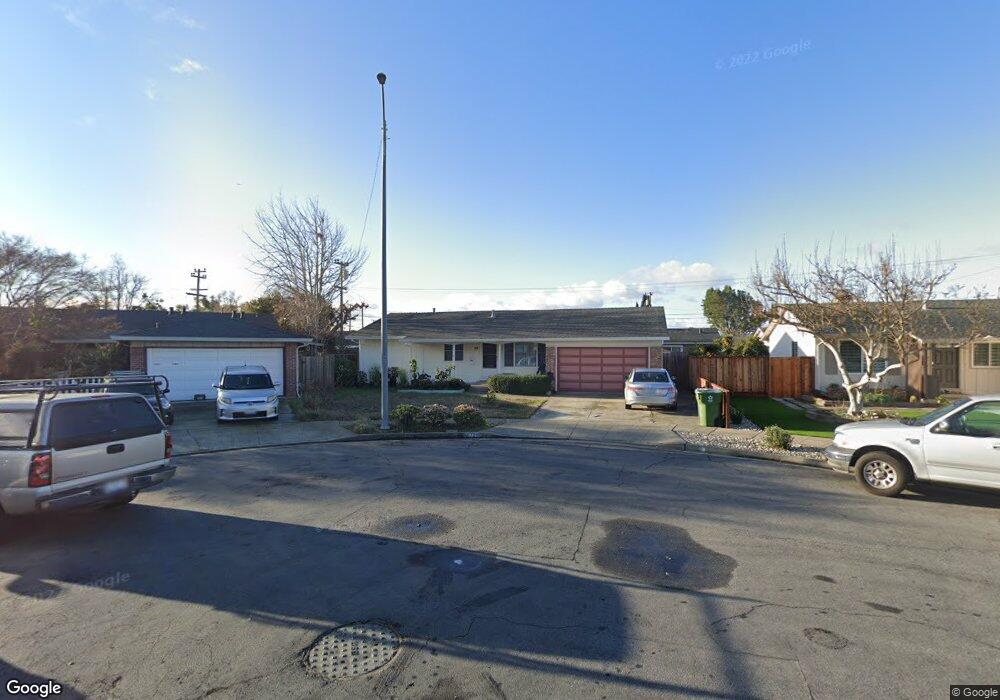
About This Home
This home is located at 36739 Theta Ct, Fremont, CA 94536 and is currently estimated at $1,423,684, approximately $985 per square foot. 36739 Theta Ct is a home located in Alameda County with nearby schools including Cabrillo Elementary School, Centerville Junior High School, and Washington High School.
Ownership History
We collect this data history from publicly available records. To have your information removed, we recommend requesting removal directly through your county’s website.
Purchase Details
Home Financials for this Owner
Home Financials are based on the most recent Mortgage that was taken out on this home.Home Values in the Area
Average Home Value in this Area
Purchase History
We collect this data history from publicly available records. To have your information removed, we recommend requesting removal directly through your county’s website.
| Date | Buyer | Sale Price | Title Company |
|---|---|---|---|
| $416,000 | Chicago Title Company |
Mortgage History
We collect this data history from publicly available records. To have your information removed, we recommend requesting removal directly through your county’s website.
| Date | Status | Borrower | Loan Amount |
|---|---|---|---|
| Open | $312,000 |
Tax History
We collect this data history from publicly available records. To have your information removed, we recommend requesting removal directly through your county’s website.
| Year | Tax Paid | Tax Assessment Tax Assessment Total Assessment is a certain percentage of the fair market value that is determined by local assessors to be the total taxable value of land and additions on the property. | Land | Improvement |
|---|---|---|---|---|
| 2025 | $6,691 | $528,670 | $160,701 | $374,969 |
| 2024 | $6,691 | $518,170 | $157,551 | $367,619 |
| 2023 | $6,503 | $514,874 | $154,462 | $360,412 |
| 2022 | $6,406 | $497,781 | $151,434 | $353,347 |
| 2021 | $6,251 | $487,885 | $148,465 | $346,420 |
| 2020 | $6,229 | $489,814 | $146,944 | $342,870 |
| 2019 | $6,159 | $480,213 | $144,064 | $336,149 |
| 2018 | $6,036 | $470,798 | $141,239 | $329,559 |
| 2017 | $5,885 | $461,568 | $138,470 | $323,098 |
| 2016 | $5,778 | $452,520 | $135,756 | $316,764 |
| 2015 | $5,695 | $445,727 | $133,718 | $312,009 |
| 2014 | $5,592 | $436,998 | $131,099 | $305,899 |
Map
- 36740 Theta Ct
- 36602 Rabo Terrace
- 4708 Portola Dr
- 4742 El Rey Ave
- 4560 Thornton Ave
- 36329 Alicante Ave
- 36262 San Pedro Dr
- 36122 Magellan Dr
- 4201 Torres Ave
- 4252 San Juan Ave
- 36234 Worthing Dr
- 37146 Blacow Rd
- 36202 Worthing Dr
- 37275 Dondero Way
- 4635 Capitan Dr
- 4929 Roselle Common
- 4468 Peralta Blvd
- 4442 Kennett Terrace
- 4467 Maybeck Terrace
- 4074 Gibraltar Dr
Ask me questions while you tour the home.