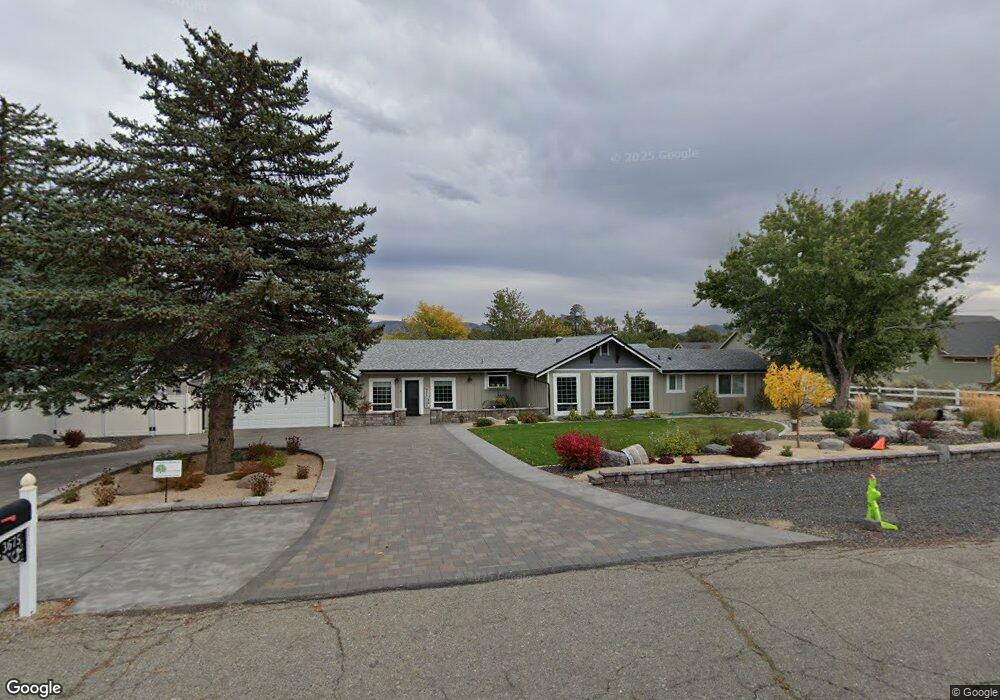
3675 Cherokee Dr Carson City, NV 89705
Estimated Value: $767,000 - $1,115,824
4
Beds
3
Baths
2,770
Sq Ft
$351/Sq Ft
Est. Value
About This Home
This home is located at 3675 Cherokee Dr, Carson City, NV 89705 and is currently estimated at $972,206, approximately $350 per square foot. 3675 Cherokee Dr is a home located in Douglas County with nearby schools including Jacks Valley Elementary School, Carson Valley Middle School, and Douglas County High School.
Ownership History
Date
Name
Owned For
Owner Type
Purchase Details
Closed on
Jul 7, 2020
Sold by
Eaton Chad and Eaton Cari
Bought by
Eaton Chad E and Eaton Cari A
Current Estimated Value
Purchase Details
Closed on
Sep 11, 2017
Sold by
Mountain Paradise Investments Llc
Bought by
Eaton Chad and Eaton Cari
Home Financials for this Owner
Home Financials are based on the most recent Mortgage that was taken out on this home.
Original Mortgage
$311,250
Outstanding Balance
$257,555
Interest Rate
3.92%
Mortgage Type
New Conventional
Estimated Equity
$714,651
Purchase Details
Closed on
Mar 4, 2014
Sold by
Cattanach Harry George and Cattanach Kathleen Kay
Bought by
Mountain Paradise Investments Llc
Purchase Details
Closed on
Mar 24, 2008
Sold by
Cattanach Harry G and Cattanach Kathleen K
Bought by
Cattanach Harry George and Cattanach Kathleen Kay
Create a Home Valuation Report for This Property
The Home Valuation Report is an in-depth analysis detailing your home's value as well as a comparison with similar homes in the area
Home Values in the Area
Average Home Value in this Area
Purchase History
| Date | Buyer | Sale Price | Title Company |
|---|---|---|---|
| Eaton Chad E | -- | None Available | |
| Eaton Chad | $375,000 | Western Title Co | |
| Mountain Paradise Investments Llc | -- | None Available | |
| Cattanach Harry George | -- | None Available |
Source: Public Records
Mortgage History
| Date | Status | Borrower | Loan Amount |
|---|---|---|---|
| Open | Eaton Chad | $311,250 |
Source: Public Records
Tax History
| Year | Tax Paid | Tax Assessment Tax Assessment Total Assessment is a certain percentage of the fair market value that is determined by local assessors to be the total taxable value of land and additions on the property. | Land | Improvement |
|---|---|---|---|---|
| 2026 | $5,852 | $209,839 | $70,000 | $139,839 |
| 2025 | $5,844 | $203,863 | $61,250 | $142,613 |
| 2024 | $5,844 | $206,030 | $61,250 | $144,780 |
| 2023 | $5,412 | $197,358 | $61,250 | $136,108 |
| 2022 | $5,011 | $180,431 | $50,750 | $129,681 |
| 2021 | $4,640 | $169,693 | $46,200 | $123,493 |
| 2020 | $4,487 | $163,480 | $42,000 | $121,480 |
| 2019 | $4,331 | $160,503 | $42,000 | $118,503 |
| 2018 | $3,931 | $138,999 | $31,500 | $107,499 |
| 2017 | $2,407 | $87,187 | $28,000 | $59,187 |
| 2016 | $2,348 | $80,956 | $22,750 | $58,206 |
| 2015 | $2,286 | $80,956 | $22,750 | $58,206 |
| 2014 | $2,215 | $78,564 | $22,750 | $55,814 |
Source: Public Records
Map
Nearby Homes
- 3662 Cindy's Trail
- 3597 Green Acre Dr
- 534 Headwaters Way
- 64 Boulders Bend Dr
- 46 Boulders Bend Dr Unit 117
- 40 Boulders Bend Dr
- 569 Headwaters Way
- 575 Headwaters Way Unit 359
- 49 Boulders Bend Dr Unit 76
- 58 Boulders Bend Dr
- APN 1420-06-701-001
- 3536 Grand View Ct
- 875 Vista Park Dr
- 3645 Vista Grande Blvd
- 3500 Green Acre Dr
- 3528 Tourmaline Ct
- 5155 Highway 50
- 3482 Calcite Cir
- 3589 Haystack Dr
- 3722 Lyla Ln
- 3673 Cherokee Dr
- 3679 Cherokee Dr
- 3676 Cherokee Dr
- 3670 Cherokee Dr
- 3669 Cherokee Dr
- 3669 Cherokee Dr Unit 11
- 3674 Green Acres Dr
- 3668 Cherokee Dr
- 3680 Green Acres Dr
- 3695 Cherokee Dr
- 795 Bucks Way
- 3670 Green Acres Dr
- 3661 Cherokee Dr
- 3686 Green Acres Dr
- 780 Bucks Way
- 3650 Green Acre Dr
- 3668 Green Acres Dr
- 3668 Green Acre Dr
- 3666 Cherokee Dr
- 3700 Cherokee Dr
Your Personal Tour Guide
Ask me questions while you tour the home.