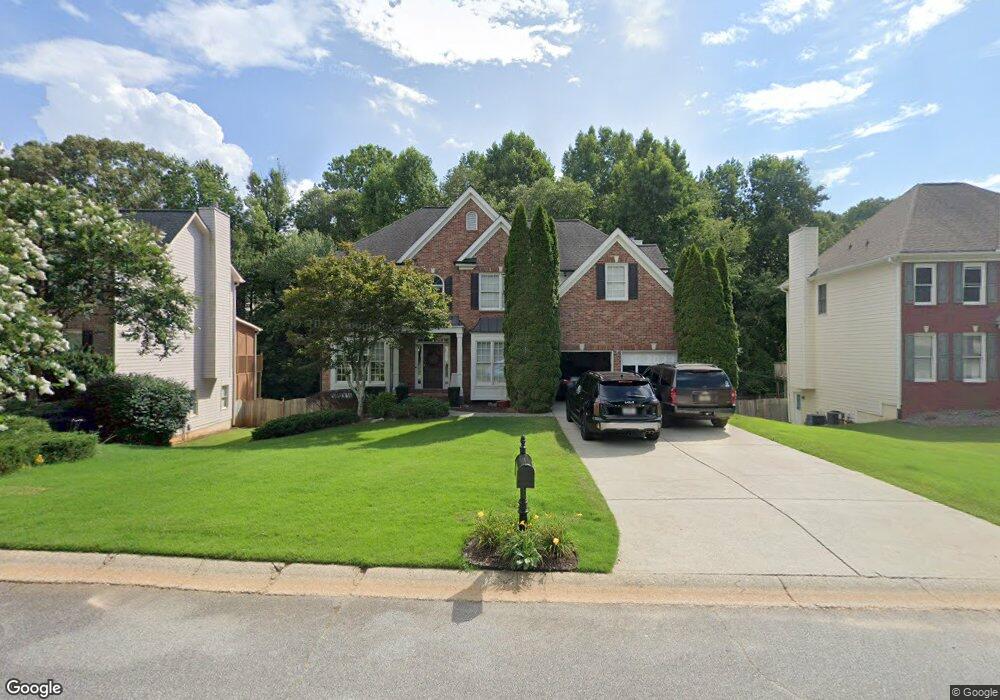
3675 Rosehaven Way Suwanee, GA 30024
Estimated Value: $541,000 - $662,000
5
Beds
3
Baths
2,887
Sq Ft
$207/Sq Ft
Est. Value
About This Home
This home is located at 3675 Rosehaven Way, Suwanee, GA 30024 and is currently estimated at $597,408, approximately $206 per square foot. 3675 Rosehaven Way is a home located in Gwinnett County with nearby schools including Roberts Elementary School, North Gwinnett Middle School, and North Gwinnett High School.
Ownership History
Date
Name
Owned For
Owner Type
Purchase Details
Closed on
Mar 30, 2009
Sold by
3675 Rosehaven Way Family Trus
Bought by
Fisher Nicholas P and Fisher Katherine F
Current Estimated Value
Home Financials for this Owner
Home Financials are based on the most recent Mortgage that was taken out on this home.
Original Mortgage
$244,391
Outstanding Balance
$154,485
Interest Rate
5.1%
Mortgage Type
FHA
Estimated Equity
$442,923
Purchase Details
Closed on
Nov 26, 2008
Sold by
Davenport John R and Davenport Melisa A
Bought by
3675 Rosehaven Way Family
Purchase Details
Closed on
Apr 18, 1997
Sold by
Touchstone Homes Inc
Bought by
Davenport John R
Home Financials for this Owner
Home Financials are based on the most recent Mortgage that was taken out on this home.
Original Mortgage
$183,400
Interest Rate
7.95%
Mortgage Type
New Conventional
Create a Home Valuation Report for This Property
The Home Valuation Report is an in-depth analysis detailing your home's value as well as a comparison with similar homes in the area
Home Values in the Area
Average Home Value in this Area
Purchase History
| Date | Buyer | Sale Price | Title Company |
|---|---|---|---|
| Fisher Nicholas P | $248,900 | -- | |
| 3675 Rosehaven Way Family | -- | -- | |
| Davenport John R | $203,800 | -- |
Source: Public Records
Mortgage History
| Date | Status | Borrower | Loan Amount |
|---|---|---|---|
| Open | Fisher Nicholas P | $244,391 | |
| Previous Owner | Davenport John R | $183,400 |
Source: Public Records
Tax History Compared to Growth
Tax History
| Year | Tax Paid | Tax Assessment Tax Assessment Total Assessment is a certain percentage of the fair market value that is determined by local assessors to be the total taxable value of land and additions on the property. | Land | Improvement |
|---|---|---|---|---|
| 2025 | $5,862 | $225,600 | $44,080 | $181,520 |
| 2024 | $5,875 | $218,280 | $49,200 | $169,080 |
| 2023 | $5,875 | $232,440 | $49,200 | $183,240 |
| 2022 | $6,811 | $208,480 | $38,800 | $169,680 |
| 2021 | $5,006 | $137,720 | $28,000 | $109,720 |
| 2020 | $5,231 | $137,720 | $28,000 | $109,720 |
| 2019 | $4,539 | $137,720 | $28,000 | $109,720 |
| 2018 | $3,348 | $101,120 | $22,400 | $78,720 |
| 2016 | $3,043 | $92,038 | $19,040 | $72,998 |
| 2015 | $3,629 | $108,280 | $22,400 | $85,880 |
| 2014 | $3,653 | $108,280 | $22,400 | $85,880 |
Source: Public Records
Map
Nearby Homes
- 3695 Rosehaven Way Unit 1
- 610 Golden Meadows Ln
- 3770 Annandale Ln
- 655 Golden Meadows Ln
- 841 Woodvale Point
- 821 Woodvale Point
- 377 Danville Ave
- 900 Woodvale Point
- 3540 Pierce Arrow Cir Unit 2
- 588 Myrtle Trace Ln
- 548 Myrtle Trace Ln
- 3484 Bonneville Way
- 3375 Pierce Arrow Cir Unit 3
- 822 Urban Grange Way
- 3793 Memphis Dr
- 3350 Wildwood Rd
- 3685 Rosehaven Way
- 3665 Rosehaven Way Unit 1
- 0 Rosehaven Way Unit 8588022
- 0 Rosehaven Way Unit 8452903
- W Rosehaven Way
- 0 Rosehaven Way Unit 8987702
- 0 Rosehaven Way Unit 8858018
- 0 Rosehaven Way Unit 3263214
- 540 Golden Meadows Ln Unit 2
- 480 Golden Meadows Ln Unit 1
- 3680 Rosehaven Way
- 505 Golden Meadows Ln Unit Furnished or Unfurni
- 505 Golden Meadows Ln
- 505 Golden Meadows Ln
- 3690 Rosehaven Way Unit 1
- 3655 Rosehaven Way
- 550 Golden Meadows Ln Unit 2
- 3705 Rosehaven Way
- 525 Golden Meadows Ln Unit 2
- 535 Golden Meadows Ln Unit 2