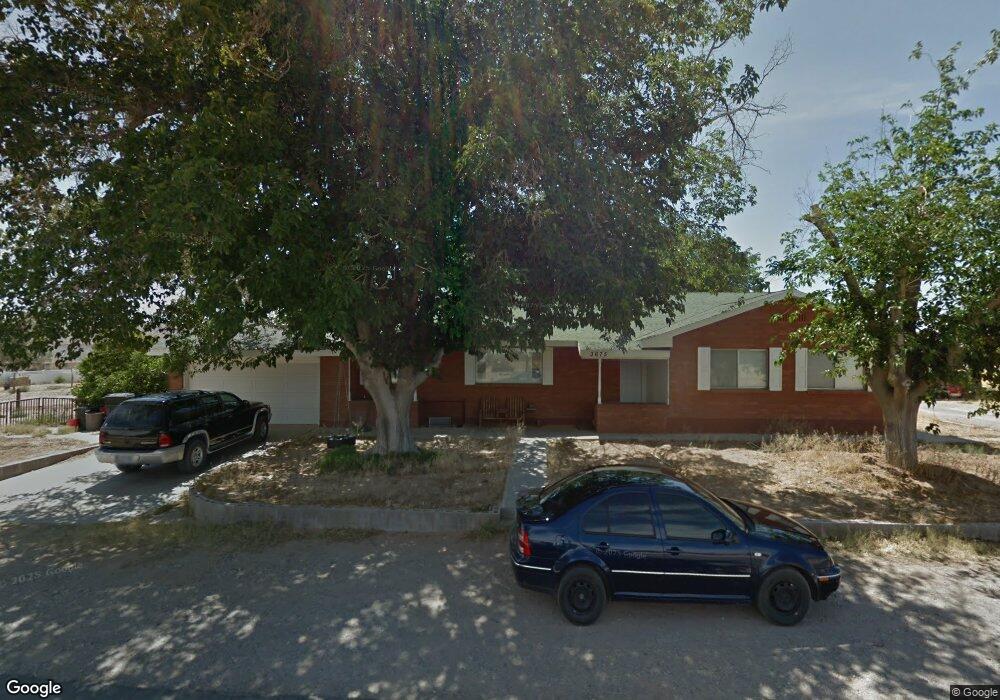
3675 Sandy St Logandale, NV 89021
Estimated Value: $500,915 - $669,000
3
Beds
2
Baths
2,047
Sq Ft
$273/Sq Ft
Est. Value
About This Home
This home is located at 3675 Sandy St, Logandale, NV 89021 and is currently estimated at $558,979, approximately $273 per square foot. 3675 Sandy St is a home with nearby schools including Grant Bowler Elementary School, Mack Lyon Middle School, and Moapa Valley High School.
Ownership History
Date
Name
Owned For
Owner Type
Purchase Details
Closed on
Jun 10, 2009
Sold by
Us Bank National Association
Bought by
Wollenzien Merlin and Wollenzien Emily
Current Estimated Value
Home Financials for this Owner
Home Financials are based on the most recent Mortgage that was taken out on this home.
Original Mortgage
$254,999
Outstanding Balance
$162,479
Interest Rate
5.25%
Mortgage Type
Unknown
Estimated Equity
$396,500
Purchase Details
Closed on
Mar 10, 2009
Sold by
Stankosky Matthew G
Bought by
Us Bank National Association and Bafc 2006-7
Purchase Details
Closed on
May 26, 2006
Sold by
Stankosky Jacqueline M
Bought by
Stankosky Matthew G
Home Financials for this Owner
Home Financials are based on the most recent Mortgage that was taken out on this home.
Original Mortgage
$339,500
Interest Rate
6.52%
Mortgage Type
Fannie Mae Freddie Mac
Purchase Details
Closed on
Apr 5, 2006
Sold by
Cameron Ralph G and Cameron Ellen K
Bought by
Stankosky Matthew G
Home Financials for this Owner
Home Financials are based on the most recent Mortgage that was taken out on this home.
Original Mortgage
$339,500
Interest Rate
6.52%
Mortgage Type
Fannie Mae Freddie Mac
Create a Home Valuation Report for This Property
The Home Valuation Report is an in-depth analysis detailing your home's value as well as a comparison with similar homes in the area
Home Values in the Area
Average Home Value in this Area
Purchase History
| Date | Buyer | Sale Price | Title Company |
|---|---|---|---|
| Wollenzien Merlin | $249,900 | First American Title Paseo V | |
| Us Bank National Association | $342,531 | First American National Defa | |
| Stankosky Matthew G | -- | Fidelity National Title | |
| Stankosky Matthew G | $485,000 | Fidelity National Title |
Source: Public Records
Mortgage History
| Date | Status | Borrower | Loan Amount |
|---|---|---|---|
| Open | Wollenzien Merlin | $254,999 | |
| Previous Owner | Stankosky Matthew G | $339,500 |
Source: Public Records
Tax History
| Year | Tax Paid | Tax Assessment Tax Assessment Total Assessment is a certain percentage of the fair market value that is determined by local assessors to be the total taxable value of land and additions on the property. | Land | Improvement |
|---|---|---|---|---|
| 2026 | $1,564 | $67,955 | $28,000 | $39,955 |
| 2025 | $1,519 | $65,087 | $25,559 | $39,528 |
| 2024 | $1,476 | $65,087 | $25,559 | $39,528 |
| 2023 | $1,476 | $60,915 | $21,131 | $39,783 |
| 2022 | $1,433 | $55,821 | $18,375 | $37,446 |
| 2021 | $1,392 | $54,154 | $17,500 | $36,654 |
| 2020 | $1,383 | $54,737 | $17,500 | $37,237 |
| 2019 | $1,372 | $54,311 | $16,800 | $37,511 |
| 2018 | $1,309 | $52,538 | $15,400 | $37,138 |
| 2017 | $1,365 | $54,004 | $15,400 | $38,604 |
| 2016 | $1,249 | $48,366 | $14,000 | $34,366 |
| 2015 | $1,247 | $48,535 | $14,000 | $34,535 |
| 2014 | $1,242 | $46,796 | $14,000 | $32,796 |
Source: Public Records
Map
Nearby Homes
- 3728 River Heights Ln
- 1545 Valley Home Ct
- 3765 Berkeley St
- 1604 Heights Dr
- 1525 Heights Dr
- 4050 Milky Way Cir
- 4045 River Heights Ln
- 1951 Jim Haworth Ct
- 0 Moapa Valley Unit 2721305
- 0 Unit 2676698
- 3782 Mahalo Cir
- 0 Skyline St
- 3156 Mateuse St
- 1990 Liston Ave
- 3195 Heyer St
- 1141 Thomas Bay Cir
- 4240 Mills St
- 1945 Clover Hollow
- 2925 Rice St
- 0 W Cram Ave
- 3640 Sandy St
- 1575 Whipple Ave
- 3645 Sandy St
- 3630 Sandy St
- 1555 Whipple Ave
- 3635 Sandy St
- 3620 Sandy St
- 1650 Chadburn Cir
- 1645 Whipple Ave
- 3590 Sandy St
- 1525 Whipple Ave
- 1540 Bert Cir
- 1665 Whipple Ave
- 1545 Bert Cir
- 3595 Sandy St
- 3744 River Heights Ln
- 3712 River Heights Ln
- 1515 Whipple Ave
- 1520 Bert Cir
- 1577 Valley Home Ct
Your Personal Tour Guide
Ask me questions while you tour the home.