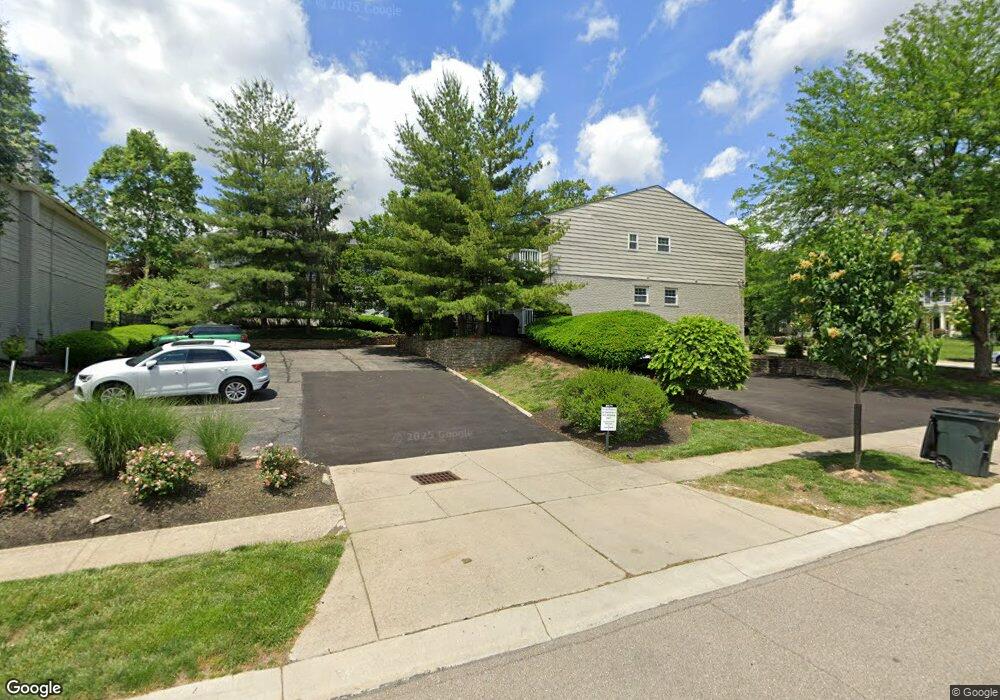
3675 Willowlea Ct Cincinnati, OH 45208
Hyde Park NeighborhoodEstimated Value: $214,026 - $263,000
1
Bed
1
Bath
722
Sq Ft
$329/Sq Ft
Est. Value
About This Home
This home is located at 3675 Willowlea Ct, Cincinnati, OH 45208 and is currently estimated at $237,507, approximately $328 per square foot. 3675 Willowlea Ct is a home located in Hamilton County with nearby schools including Kilgour Elementary School, Clark Montessori High School, and Shroder High School.
Ownership History
Date
Name
Owned For
Owner Type
Purchase Details
Closed on
Apr 5, 2018
Sold by
Hpp Properties Llc
Bought by
Spiegel Roger Daniel and Spiegel Mary Catherine
Current Estimated Value
Purchase Details
Closed on
Aug 9, 2013
Sold by
Simon Richard M and Gould Karen L
Bought by
Mcevoy Jonatha M
Purchase Details
Closed on
Aug 31, 2005
Sold by
Cronin Wheeler Willowlea Properties Llc
Bought by
Simon Richard M and Gould Karen L
Home Financials for this Owner
Home Financials are based on the most recent Mortgage that was taken out on this home.
Original Mortgage
$136,000
Interest Rate
5.37%
Mortgage Type
FHA
Purchase Details
Closed on
Aug 2, 2004
Sold by
Hyde Park Place Ltd
Bought by
Cronin Wheeler Willowlea Properties Llc
Home Financials for this Owner
Home Financials are based on the most recent Mortgage that was taken out on this home.
Original Mortgage
$400,000
Interest Rate
6.35%
Mortgage Type
Purchase Money Mortgage
Create a Home Valuation Report for This Property
The Home Valuation Report is an in-depth analysis detailing your home's value as well as a comparison with similar homes in the area
Home Values in the Area
Average Home Value in this Area
Purchase History
| Date | Buyer | Sale Price | Title Company |
|---|---|---|---|
| Spiegel Roger Daniel | $142,500 | None Available | |
| Mcevoy Jonatha M | $130,000 | Attorney | |
| Simon Richard M | $170,000 | Chicago Title Insurance Co | |
| Cronin Wheeler Willowlea Properties Llc | -- | -- |
Source: Public Records
Mortgage History
| Date | Status | Borrower | Loan Amount |
|---|---|---|---|
| Previous Owner | Simon Richard M | $136,000 | |
| Previous Owner | Cronin Wheeler Willowlea Properties Llc | $400,000 |
Source: Public Records
Tax History
| Year | Tax Paid | Tax Assessment Tax Assessment Total Assessment is a certain percentage of the fair market value that is determined by local assessors to be the total taxable value of land and additions on the property. | Land | Improvement |
|---|---|---|---|---|
| 2025 | $3,686 | $58,163 | $7,700 | $50,463 |
| 2023 | $3,688 | $58,163 | $7,700 | $50,463 |
| 2022 | $3,516 | $49,875 | $7,700 | $42,175 |
| 2021 | $3,456 | $49,875 | $7,700 | $42,175 |
| 2020 | $3,466 | $49,875 | $7,700 | $42,175 |
| 2019 | $3,328 | $43,596 | $7,000 | $36,596 |
| 2018 | $3,326 | $43,596 | $7,000 | $36,596 |
| 2017 | $3,204 | $43,596 | $7,000 | $36,596 |
| 2016 | $3,428 | $45,500 | $6,160 | $39,340 |
| 2015 | $1,126 | $45,500 | $6,160 | $39,340 |
| 2014 | $1,132 | $45,500 | $6,160 | $39,340 |
| 2013 | $1,149 | $45,885 | $7,000 | $38,885 |
Source: Public Records
Map
Nearby Homes
- 3437 Traskwood Cir
- 3474 Forestoak Ct
- 3615 Old Red Bank Rd
- 3635 Ault Park Ave
- 3431 Pape Ave
- 3460 Custer Ave
- 3649 Herschel Ave
- 3613 Herschel Ave
- 3407 Aston Ct Unit 4
- 4422 Canyon Oak Ct
- 4418 Canyon Oak Ct
- 2947 Iron Oak Ln
- 3414 Oak Ln
- 3443 Ault View Ave
- 3508 Tarpis Ave
- 4115 Paxton Woods Dr
- 3806 Brotherton Rd
- 3509 Tarpis Ave
- 4153 Paxton Woods Ln
- 3709 Brotherton Rd
- 3675 Willowlea Ct Unit 1
- 3675 Willowlea Ct Unit D
- 3675 Willowlea Ct Unit 3675
- 3675 Willowlea Ct
- 3675 Willowlea Ct Unit 3
- 3675 Willowlea Ct
- 3675 Willowlea Ct Unit 3675EW
- 3675 Willowlea Ct Unit 5
- 3675 Willowlea Ct Unit 6
- 3675 Willowlea Ct Unit 4
- 3675 Willowlea Ct Unit 2
- 3675 Beecham Ln Unit 3675AB
- 3675 Beecham Ln
- 3675 Beecham Ln Unit A
- 3721 Ashworth Dr Unit 3721D
- 3721 Ashworth Dr Unit 3721C
- 3721 Ashworth Dr Unit 3721B
- 3721 Ashworth Dr Unit 3721A
- 3721 Ashworth Dr Unit A
- 3721 Ashworth Dr