Estimated Value: $390,000 - $436,172
3
Beds
1
Bath
962
Sq Ft
$428/Sq Ft
Est. Value
About This Home
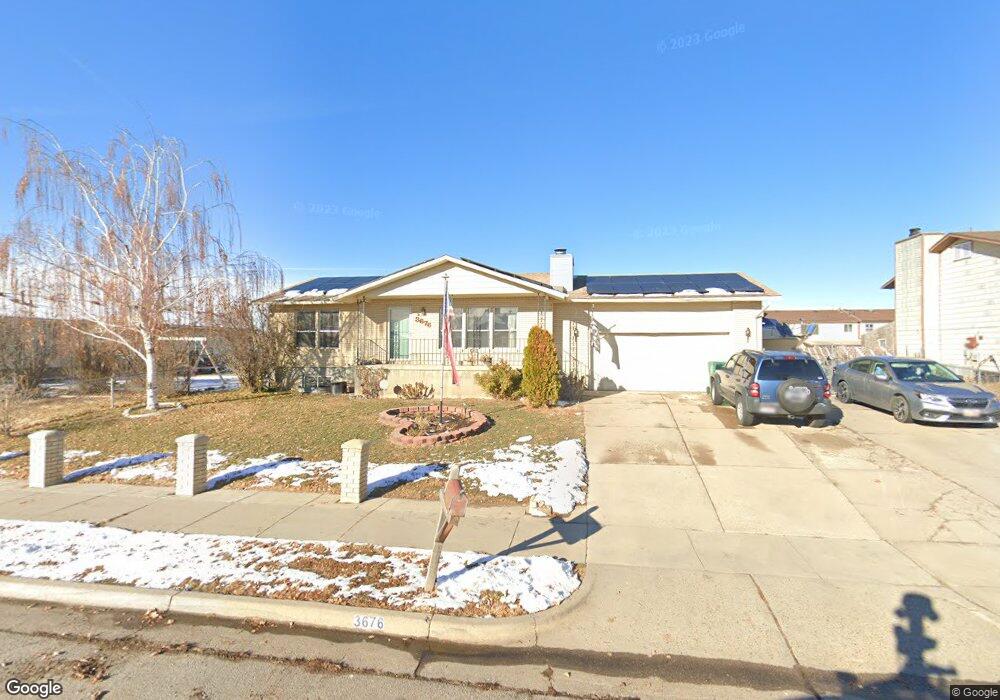
This home is located at 3676 W 4700 S, Roy, UT 84067 and is currently estimated at $412,043, approximately $428 per square foot. 3676 W 4700 S is a home located in Weber County with nearby schools including West Haven School, Sand Ridge Junior High School, and Roy High School.
Ownership History
Date
Name
Owned For
Owner Type
Purchase Details
Closed on
Aug 29, 2025
Sold by
Clarke Richard
Bought by
Rash Cynthia Kaye
Current Estimated Value
Home Financials for this Owner
Home Financials are based on the most recent Mortgage that was taken out on this home.
Original Mortgage
$387,845
Outstanding Balance
$387,845
Interest Rate
6.75%
Mortgage Type
FHA
Estimated Equity
$24,198
Purchase Details
Closed on
Nov 22, 2022
Sold by
Clarke Richard
Bought by
Clarke Richard
Home Financials for this Owner
Home Financials are based on the most recent Mortgage that was taken out on this home.
Original Mortgage
$344,000
Interest Rate
6.94%
Mortgage Type
New Conventional
Purchase Details
Closed on
Mar 29, 2022
Sold by
Rash Cynthia K
Bought by
Clarke Richard
Purchase Details
Closed on
Jul 19, 2006
Sold by
Stumpp Steven J and Stumpp Francis J
Bought by
Jackson John W and Jackson Wanda J
Home Financials for this Owner
Home Financials are based on the most recent Mortgage that was taken out on this home.
Original Mortgage
$110,000
Interest Rate
6.57%
Mortgage Type
Purchase Money Mortgage
Create a Home Valuation Report for This Property
The Home Valuation Report is an in-depth analysis detailing your home's value as well as a comparison with similar homes in the area
Home Values in the Area
Average Home Value in this Area
Purchase History
| Date | Buyer | Sale Price | Title Company |
|---|---|---|---|
| Rash Cynthia Kaye | -- | Title Guarantee | |
| Clarke Richard | -- | -- | |
| Clarke Richard | -- | Rei Title | |
| Jackson John W | -- | Equity Title |
Source: Public Records
Mortgage History
| Date | Status | Borrower | Loan Amount |
|---|---|---|---|
| Open | Rash Cynthia Kaye | $387,845 | |
| Closed | Rash Cynthia Kaye | $13,825 | |
| Previous Owner | Clarke Richard | $344,000 | |
| Previous Owner | Jackson John W | $110,000 | |
| Closed | Clarke Richard | $0 |
Source: Public Records
Tax History Compared to Growth
Tax History
| Year | Tax Paid | Tax Assessment Tax Assessment Total Assessment is a certain percentage of the fair market value that is determined by local assessors to be the total taxable value of land and additions on the property. | Land | Improvement |
|---|---|---|---|---|
| 2025 | $2,452 | $434,422 | $130,075 | $304,347 |
| 2024 | $2,393 | $234,849 | $71,541 | $163,308 |
| 2023 | $2,305 | $226,600 | $57,588 | $169,012 |
| 2022 | $2,597 | $260,151 | $56,560 | $203,591 |
| 2021 | $1,992 | $331,000 | $73,179 | $257,821 |
| 2020 | $1,905 | $290,000 | $73,179 | $216,821 |
| 2019 | $1,829 | $263,000 | $45,791 | $217,209 |
| 2018 | $1,876 | $255,001 | $41,622 | $213,379 |
| 2017 | $1,600 | $205,000 | $41,622 | $163,378 |
| 2016 | $1,526 | $105,436 | $21,646 | $83,790 |
| 2015 | $1,272 | $90,638 | $21,646 | $68,992 |
| 2014 | $1,286 | $90,638 | $21,646 | $68,992 |
Source: Public Records
Map
Nearby Homes
- 3671 W 4700 S
- 3627 W 4650 S
- 3632 W 4650 S
- 3692 W 4625 S
- 3652 W 4625 S
- Poplar Plan at Highgate Cove
- Pando Plan at Highgate Cove
- Villages Townhome Plan at Green Farm - Villages
- 3524 W 4835 S Unit 22
- 3523 W 4835 S Unit 28
- 3509 W 4835 S Unit 26
- 3610 W 4475 S
- 3820 Foxglen Dr
- 3434 W 4525 S
- 4024 W 4650 S
- 4964 S 3375 W
- 4491 Haven Creek Rd Unit A
- 4094 W 4700 S
- 4097 W 4750 S
- 4510 Stone Creek Rd Unit F